Unlock a world of possibilities! Login now and discover the exclusive benefits awaiting you.
- Qlik Community
- :
- All Forums
- :
- QlikView App Dev
- :
- The lovely YTD expression :0(
- Subscribe to RSS Feed
- Mark Topic as New
- Mark Topic as Read
- Float this Topic for Current User
- Bookmark
- Subscribe
- Mute
- Printer Friendly Page
- Mark as New
- Bookmark
- Subscribe
- Mute
- Subscribe to RSS Feed
- Permalink
- Report Inappropriate Content
The lovely YTD expression :0(
Hello all;
I have a bit of an issue, I want to display the YTD on my line graph by month. Unfortunately I cant upload any contents due to the highly sensitive nature of the data. I used this expression which I pulled from one of you in the community, which now has my fields listed:
=Sum({<YearNBR={$(=Max({1}YearNBR))}>} JournalAmount)
the expression worked great initially because no matter what month/year I selected it remained as the current year data, however; when I reloaded, the charts no longer disregards all selections. All I want to do is have the chart(s) stay at the sum of the journal entries by month for the current year regardless of what month/year is chosen. Below is a snapshot of the chart, expression and date filters on the left. Any help on this would be much appreciated! uhhhggggg btw I have section access set up on this dashboard as well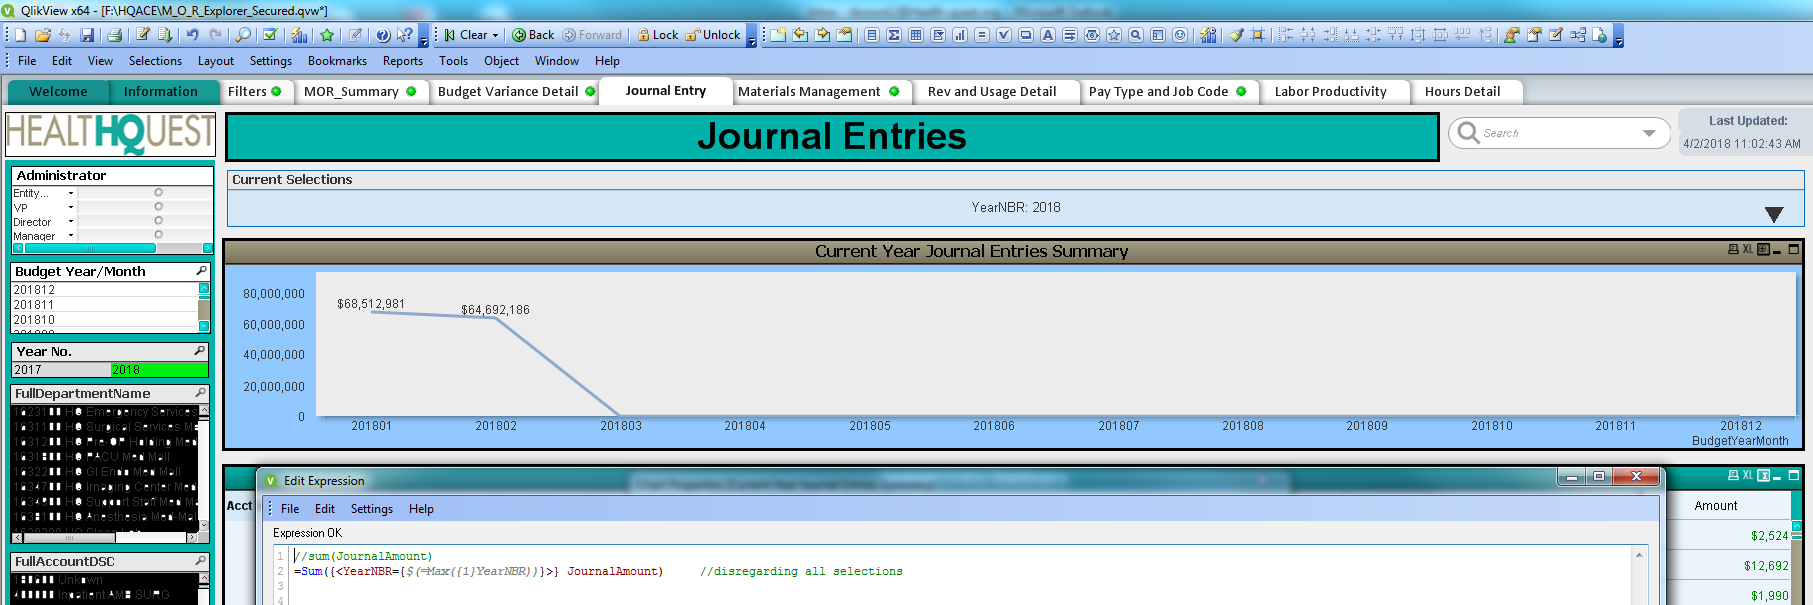
Accepted Solutions
- Mark as New
- Bookmark
- Subscribe
- Mute
- Subscribe to RSS Feed
- Permalink
- Report Inappropriate Content
May be try this
=Sum({1<YearNBR={$(=Max({1}YearNBR))}>} JournalAmount)
- Mark as New
- Bookmark
- Subscribe
- Mute
- Subscribe to RSS Feed
- Permalink
- Report Inappropriate Content
May be try this
=Sum({1<YearNBR={$(=Max({1}YearNBR))}>} JournalAmount)
- Mark as New
- Bookmark
- Subscribe
- Mute
- Subscribe to RSS Feed
- Permalink
- Report Inappropriate Content
Hello Sunny,
I appreciate your response, when I tried your suggestion it affected the sum, but it did hold the year view any idea why?
- Mark as New
- Bookmark
- Subscribe
- Mute
- Subscribe to RSS Feed
- Permalink
- Report Inappropriate Content
affected the sum? does that mean the value of sum changed? May be you don't want to ignore all selections, but only a few of them? If that is true, then maybe try like this
=Sum({<YearNBR={$(=Max({1}YearNBR))}, Year, Month, Quarter, QuarterYear, MonthYear>} JournalAmount)
The above expression ignores selection in few Date and Time related fields, but respect selection in everything else.
- Mark as New
- Bookmark
- Subscribe
- Mute
- Subscribe to RSS Feed
- Permalink
- Report Inappropriate Content
yes the value of the sum changed, I will give it a shot and let you know
- Mark as New
- Bookmark
- Subscribe
- Mute
- Subscribe to RSS Feed
- Permalink
- Report Inappropriate Content
Uhhgg my apologies Sunny, your 1st suggestion did work I put the expression on the wrong chart without updating my field name....it figures. Thankyou! I will mark your 1st response as correct/answered