Unlock a world of possibilities! Login now and discover the exclusive benefits awaiting you.
- Qlik Community
- :
- All Forums
- :
- QlikView App Dev
- :
- Re: Totals for all columns in pivot table
- Subscribe to RSS Feed
- Mark Topic as New
- Mark Topic as Read
- Float this Topic for Current User
- Bookmark
- Subscribe
- Mute
- Printer Friendly Page
- Mark as New
- Bookmark
- Subscribe
- Mute
- Subscribe to RSS Feed
- Permalink
- Report Inappropriate Content
Totals for all columns in pivot table
Hi, I have this pivot table where the second column are my expressions.
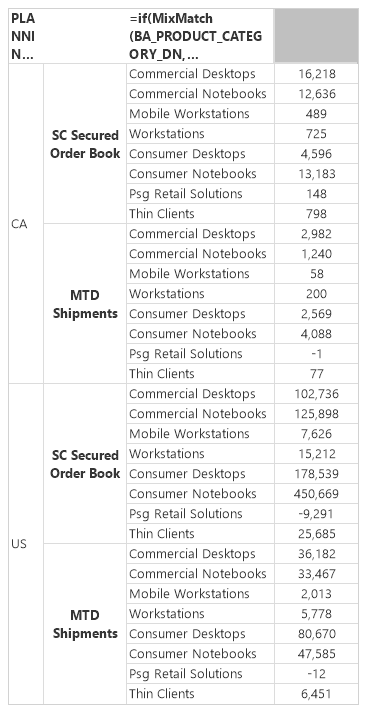
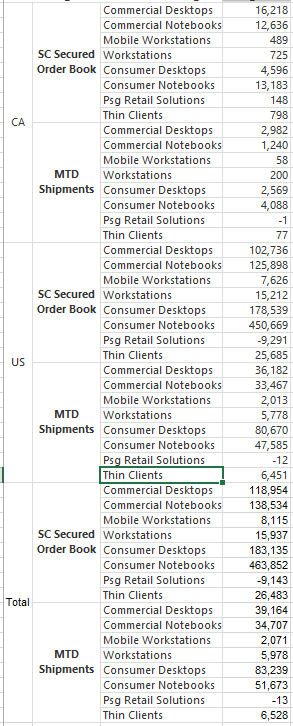
How can I get a Big Total so it looks like this, instead of partial sums by dimension
Thanks in advance!
Accepted Solutions
- Mark as New
- Bookmark
- Subscribe
- Mute
- Subscribe to RSS Feed
- Permalink
- Report Inappropriate Content
Hi Oscar,
If user don't need to filter the first and second dimension, I think you can use valuelist() to do the dimension, like
valuelist('US','CA','Total').
And also change the expression.
But if you have filter about the dimension, I think I need to find another to solve it.
Aiolos
- Mark as New
- Bookmark
- Subscribe
- Mute
- Subscribe to RSS Feed
- Permalink
- Report Inappropriate Content
Hi
can you please share the sample app with data ? It will be lot easier of you calculate the fact data based on 2 OR many countries in the data model itself.
- Mark as New
- Bookmark
- Subscribe
- Mute
- Subscribe to RSS Feed
- Permalink
- Report Inappropriate Content
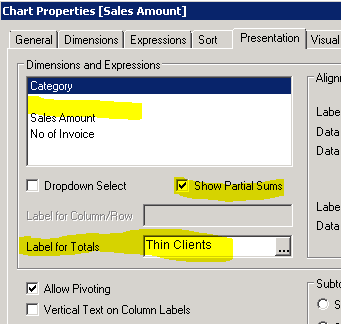
In Presentation tab - Select your 2nd dimension - Then check show partial sums option - then give Label as Thin Clients in Labe for Totals text box. Like below:
- Mark as New
- Bookmark
- Subscribe
- Mute
- Subscribe to RSS Feed
- Permalink
- Report Inappropriate Content
Hi Oscar,
If user don't need to filter the first and second dimension, I think you can use valuelist() to do the dimension, like
valuelist('US','CA','Total').
And also change the expression.
But if you have filter about the dimension, I think I need to find another to solve it.
Aiolos
- Mark as New
- Bookmark
- Subscribe
- Mute
- Subscribe to RSS Feed
- Permalink
- Report Inappropriate Content
Hi Aiolos, thanks for your answer, the user won't be filtering the dimensions, what my expression should look like? I guess I need an IF or set analysis to filter based in the valuelist
- Mark as New
- Bookmark
- Subscribe
- Mute
- Subscribe to RSS Feed
- Permalink
- Report Inappropriate Content
I got it working, thanks Aiolos! the valuelist did the trick
- Mark as New
- Bookmark
- Subscribe
- Mute
- Subscribe to RSS Feed
- Permalink
- Report Inappropriate Content
You're welcome, glad to help you~