Unlock a world of possibilities! Login now and discover the exclusive benefits awaiting you.
- Qlik Community
- :
- All Forums
- :
- QlikView App Dev
- :
- Transpose Fields
- Subscribe to RSS Feed
- Mark Topic as New
- Mark Topic as Read
- Float this Topic for Current User
- Bookmark
- Subscribe
- Mute
- Printer Friendly Page
- Mark as New
- Bookmark
- Subscribe
- Mute
- Subscribe to RSS Feed
- Permalink
- Report Inappropriate Content
Transpose Fields
Hi,
Have a requirement is that, have one table
| Date | Canada | USA | UK | FRANCE |
| 1/01/2015 | 10 | 20 | 30 | 40 |
| 2/01/2015 | 20 | 30 | 40 | 50 |
| 3/01/2015 | 30 | 40 | 50 | 60 |
| 4/01/2015 | 40 | 50 | 60 | 70 |
| 5/01/2015 | 50 | 60 | 70 | 80 |
| 6/01/2015 | 60 | 70 | 80 | 90 |
| 7/01/2015 | 70 | 80 | 90 | 100 |
| 8/01/2015 | 80 | 90 | 100 | 110 |
| 9/01/2015 | 90 | 100 | 110 | 120 |
After transposing the result is some thing like:
| Date | Country | Value |
| 1/01/2015 | Canada | 10 |
| 1/01/2015 | USA | 20 |
| 1/01/2015 | UK | 30 |
| 1/01/2015 | FRANCE | 40 |
| 2/01/2015 | Canada | 20 |
| 2/01/2015 | USA | 30 |
| 2/01/2015 | UK | 40 |
| 2/01/2015 | FRANCE | 50 |
Can please help me out to get the same.
- « Previous Replies
-
- 1
- 2
- Next Replies »
- Mark as New
- Bookmark
- Subscribe
- Mute
- Subscribe to RSS Feed
- Permalink
- Report Inappropriate Content
Sasi,
Try:
Cross Table Concept:
A cross table is a common type of table featuring a matrix of values between two orthogonal lists of header data. It could look like the table below:
Example:
- a.csv
Year | Jan | Feb | Mar | Apr | May |
1991 | 45 | 65 | 78 | 12 | 78 |
1992 | 11 | 23 | 22 | 22 | 45 |
1993 | 65 | 56 | 22 | 79 | 12 |
1994 | 65 | 24 | 32 | 78 | 55 |
1995 | 45 | 56 | 35 | 78 | 68 |
If this table is simply loaded into QlikView, the result will be one field for Year and one field for each of the months. This is generally not what you would like to have. One would probably prefer to have three fields generated, one for each header category (Year and Month) and one for the data values inside the matrix.
This can be achieved by adding the crosstable prefix to your load or select statement.The statement for loading this cross table could be:
crosstable (Month, Sales) load * from a.csv;
The result in QlikView would be as follows:
Year | Month | Sales |
1991 | Jan | 45 |
1992 | Feb | 11 |
1993 | Mar | 65 |
1994 | Apr | 65 |
1995 | May | 65 |
23 | ||
56 | ||
24 |
Thanks,
AS
- Mark as New
- Bookmark
- Subscribe
- Mute
- Subscribe to RSS Feed
- Permalink
- Report Inappropriate Content
CrossTable(Country, Value)
LOAD Date,
Canada,
USA,
UK,
FRANCE
FROM
[https://community.qlik.com/thread/172812]
(html, codepage is 1252, embedded labels, table is @1);
- Mark as New
- Bookmark
- Subscribe
- Mute
- Subscribe to RSS Feed
- Permalink
- Report Inappropriate Content
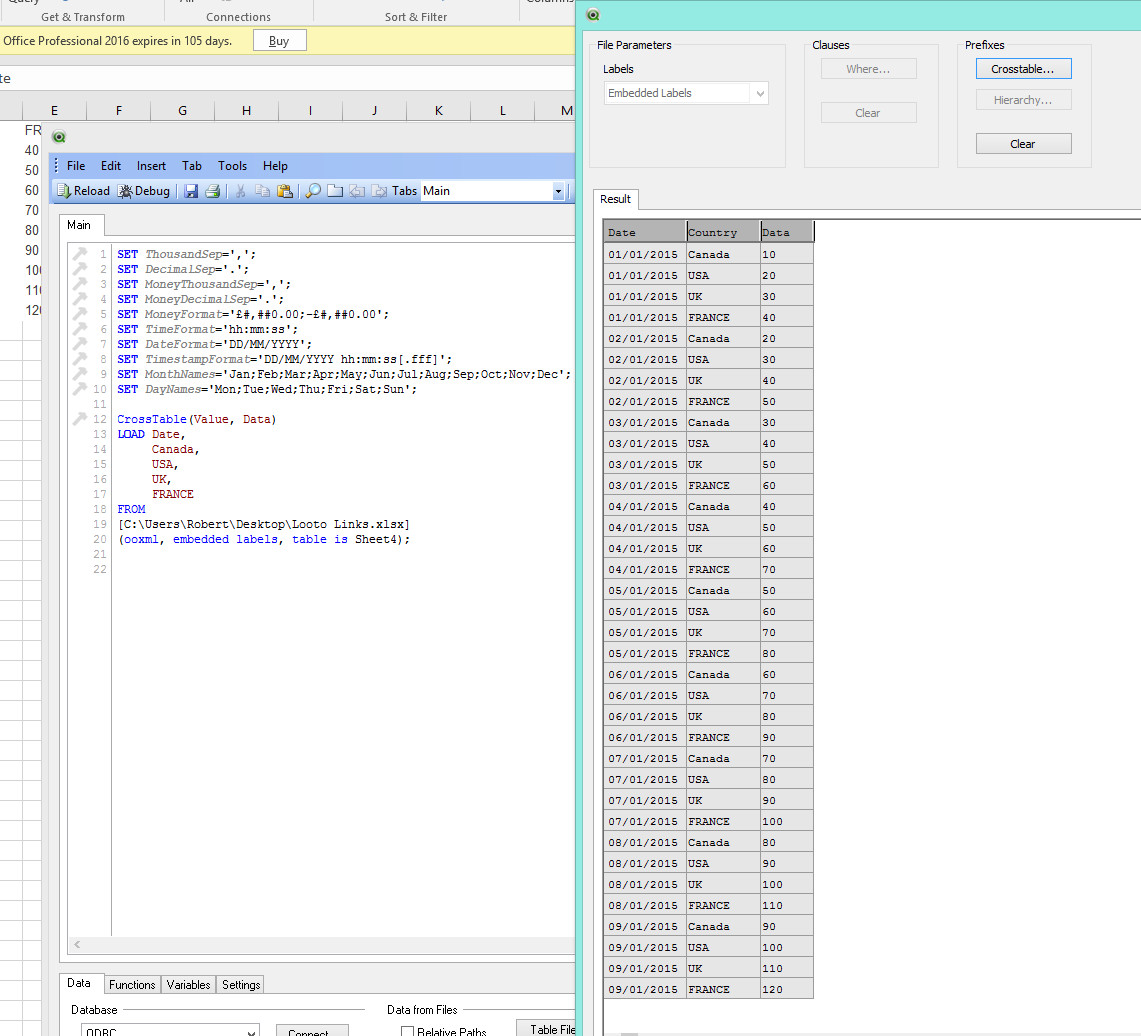
Use CrossTable:
CrossTable(Country, Data)
LOAD Date,
Canada,
USA,
UK,
FRANCE
FROM
...
Feeling Qlikngry?
- Mark as New
- Bookmark
- Subscribe
- Mute
- Subscribe to RSS Feed
- Permalink
- Report Inappropriate Content
CrossTable(Country, Data)
Load
Date,
Canada,
USA,
UK,
FRANCE
From your table;
- Mark as New
- Bookmark
- Subscribe
- Mute
- Subscribe to RSS Feed
- Permalink
- Report Inappropriate Content
Hi Sasi
Please find attachhed app
CrossTable(Country, Values)
LOAD Date,
Canada,
USA,
UK,
FRANCE
FROM
[..\11.xlsx]
(ooxml, embedded labels, table is Sheet1);
- Mark as New
- Bookmark
- Subscribe
- Mute
- Subscribe to RSS Feed
- Permalink
- Report Inappropriate Content
Use cross table concept
CrossTable(Country, Values,1)
Load * Inline [
Date, Canada, USA, UK, FRANCE
1/01/2015, 10, 20, 30, 40
2/01/2015, 20, 30, 40, 50
3/01/2015, 30, 40, 50, 60
4/01/2015, 40, 50, 60, 70
5/01/2015, 50, 60, 70, 80
6/01/2015, 60, 70, 80, 90
7/01/2015, 70, 80, 90 ,100
8/01/2015, 80, 90, 100,110
9/01/2015, 90, 100,110,120 ];
- Mark as New
- Bookmark
- Subscribe
- Mute
- Subscribe to RSS Feed
- Permalink
- Report Inappropriate Content
Hi,
thanks for your reply.
If I have more fields apart from the Date and country then can please tell me how to use cross table syntax.
- Mark as New
- Bookmark
- Subscribe
- Mute
- Subscribe to RSS Feed
- Permalink
- Report Inappropriate Content
- Mark as New
- Bookmark
- Subscribe
- Mute
- Subscribe to RSS Feed
- Permalink
- Report Inappropriate Content
Hi Sasi,
You can Use Cross Table
CrossTable(Country, Data)
Load
Date,
Canada,
USA,
UK,
FRANCE
From your table;
or else you can
Step-1:Go to Edit Script and select the data source (Excel, CSV ...)
Step-2: Click on next button twice and after that click on CrossTable.
Above, you can select Qualifier fields, Name for Attribute Filed and Data Values. You can see the color combination with these related filed also. Press OK. Now Data is converted to Straight Table.
Now, Click on Finish.
Hope this helps!
- « Previous Replies
-
- 1
- 2
- Next Replies »