Unlock a world of possibilities! Login now and discover the exclusive benefits awaiting you.
- Qlik Community
- :
- All Forums
- :
- QlikView App Dev
- :
- Trying to overlay meta data onto a chart
Options
- Subscribe to RSS Feed
- Mark Topic as New
- Mark Topic as Read
- Float this Topic for Current User
- Bookmark
- Subscribe
- Mute
- Printer Friendly Page
Turn on suggestions
Auto-suggest helps you quickly narrow down your search results by suggesting possible matches as you type.
Showing results for
Luminary Alumni
2014-10-15
08:05 AM
- Mark as New
- Bookmark
- Subscribe
- Mute
- Subscribe to RSS Feed
- Permalink
- Report Inappropriate Content
Trying to overlay meta data onto a chart
Hi Folks,
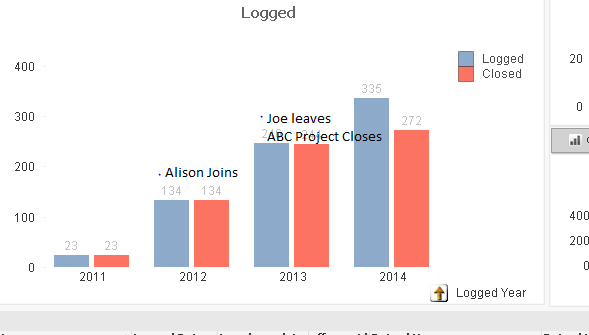
I have a chart that I want to overlay meta data onto to show key information, such as when employees joined and left our team, which may help to explain the data more.
At the moment I have an inline table, holding the meta data joined on MonthYear to the main table and I am trying to show the data as an additional dimension. It's not working too well, does anyone have any ideas as to how I could go about achieving this? The chart below shows what I am trying to achieve.
Many thanks
George
107 Views
0 Replies