Unlock a world of possibilities! Login now and discover the exclusive benefits awaiting you.
- Qlik Community
- :
- All Forums
- :
- QlikView App Dev
- :
- Use a combo chart to display a dynamic target
- Subscribe to RSS Feed
- Mark Topic as New
- Mark Topic as Read
- Float this Topic for Current User
- Bookmark
- Subscribe
- Mute
- Printer Friendly Page
- Mark as New
- Bookmark
- Subscribe
- Mute
- Subscribe to RSS Feed
- Permalink
- Report Inappropriate Content
Use a combo chart to display a dynamic target
Hello everyone,
I have a bar chart which represent on x axis some dates and on y axis some values
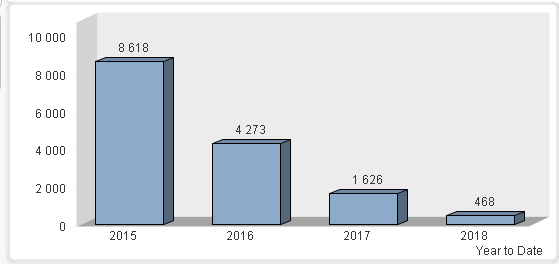
I have a target for each month.
SO i said using a combo chart could be a solution to resolve the problem.
But as I'm new and not very skilled enough with formula I don't really know how to process.
Has anyone had this issue before ?
Thank you ?
- « Previous Replies
-
- 1
- 2
- Next Replies »
- Mark as New
- Bookmark
- Subscribe
- Mute
- Subscribe to RSS Feed
- Permalink
- Report Inappropriate Content
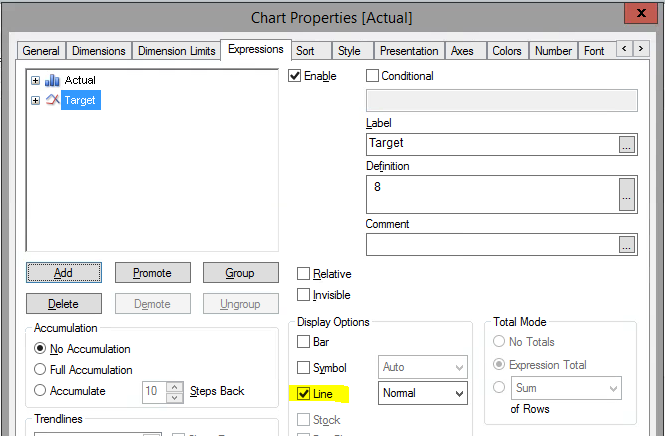
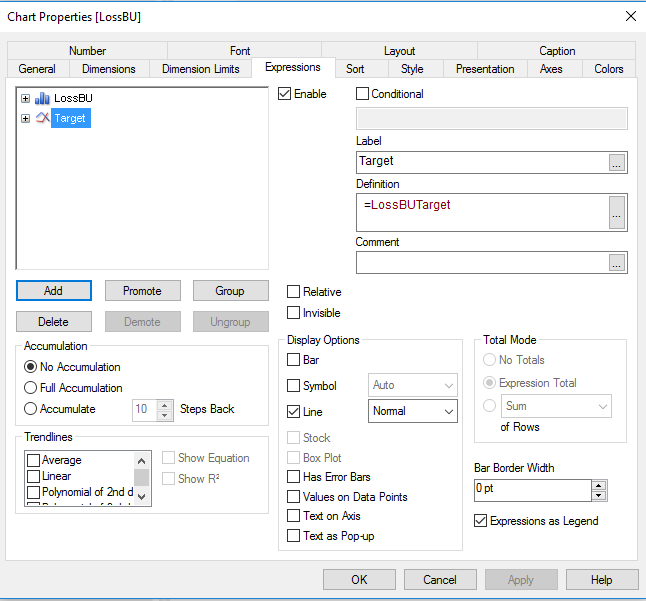
You can add the second measure (Target in your example) and tick the check box as Line in display options under Expressions.
Note: You have to use combo chart.
Thanks,
Shan S
- Mark as New
- Bookmark
- Subscribe
- Mute
- Subscribe to RSS Feed
- Permalink
- Report Inappropriate Content
Yeah thank you.
TO do that i know.
But what i want to do is to display a target for each year (2015 to 2018).
SO do i need to create 4 distinct line chart.
ANd if created what is the exact formula to put ?
Thank you
- Mark as New
- Bookmark
- Subscribe
- Mute
- Subscribe to RSS Feed
- Permalink
- Report Inappropriate Content
don't need to write 4 expressions, if you have a measure called target and which is having value for all years (2015 to 2018), then the line chart will display continuously.
If not clear please upload a sample app, I will try and let you know.
Thanks,
Shan S
- Mark as New
- Bookmark
- Subscribe
- Mute
- Subscribe to RSS Feed
- Permalink
- Report Inappropriate Content
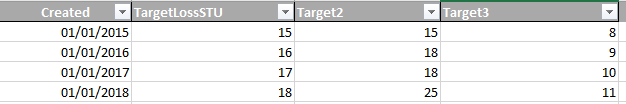
The thing is I don't have a measure of the goal on my excel files.
It's not located on any field.
I know that the target are 100 150 200 175. And I wanted to include this number in a formula.
With the form: "If -->date =2015, then 100 etc"
Is it possible ?
- Mark as New
- Bookmark
- Subscribe
- Mute
- Subscribe to RSS Feed
- Permalink
- Report Inappropriate Content
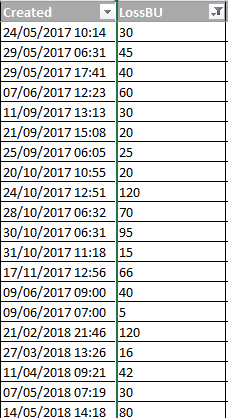
I don't know how to upload an excel and a qvw file. But anyway here are all my datas.
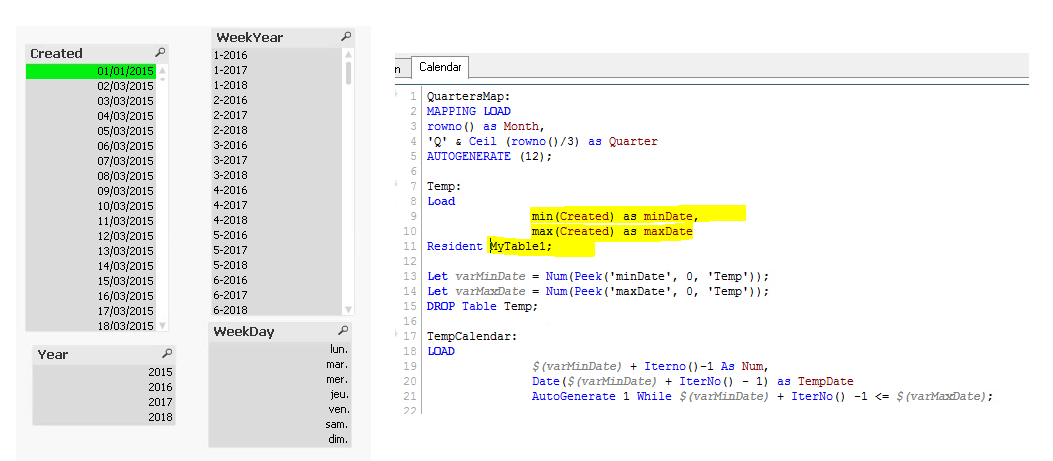
Basically my target are monthly but In the field created i put the date in this format so my master calendar could read it. "
QuartersMap:
MAPPING LOAD
rowno() as Month,
'Q' & Ceil (rowno()/3) as Quarter
AUTOGENERATE (12);
Temp:
Load
min(Created) as minDate,
max(Created) as maxDate
Resident MyTable1;
Let varMinDate = Num(Peek('minDate', 0, 'Temp'));
Let varMaxDate = Num(Peek('maxDate', 0, 'Temp'));
DROP Table Temp;
TempCalendar:
LOAD
$(varMinDate) + Iterno()-1 As Num,
Date($(varMinDate) + IterNo() - 1) as TempDate
AutoGenerate 1 While $(varMinDate) + IterNo() -1 <= $(varMaxDate);
MasterCalendar:
Load
TempDate as Created,
week(TempDate) As Week,
Year(TempDate) As Year,
Month(TempDate) As Month,
Day(TempDate) As Day,
YeartoDate(TempDate)*-1 as CurYTDFlag,
YeartoDate(TempDate,-1)*-1 as LastYTDFlag,
inyear(TempDate, Monthstart($(varMaxDate)),-1) as RC12,
date(monthstart(TempDate), 'MMM-YYYY') as MonthYear,
ApplyMap('QuartersMap', month(TempDate), Null()) as Quarter,
Week(weekstart(TempDate)) & '-' & WeekYear(TempDate) as WeekYear,
WeekDay(TempDate) as WeekDay
Resident TempCalendar
Order By TempDate ASC;
Drop Table TempCalendar; "
I have a cycle drip per chart which contain week and month. And i want to display my monthly target. And i want also my target to be converted in week for the weekly x axis
Have you got enough informations ?
- Mark as New
- Bookmark
- Subscribe
- Mute
- Subscribe to RSS Feed
- Permalink
- Report Inappropriate Content
Here are simplified version of my files.
By the way i'm using qlikview personal edition so I won't be able to modify the file...
- Mark as New
- Bookmark
- Subscribe
- Mute
- Subscribe to RSS Feed
- Permalink
- Report Inappropriate Content
Hi,
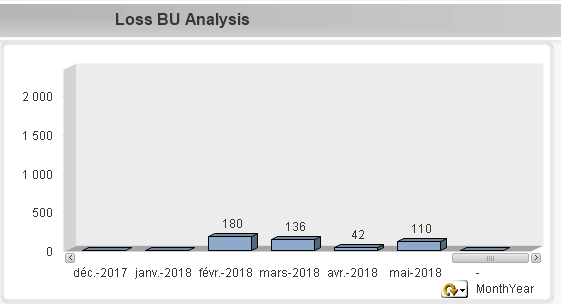
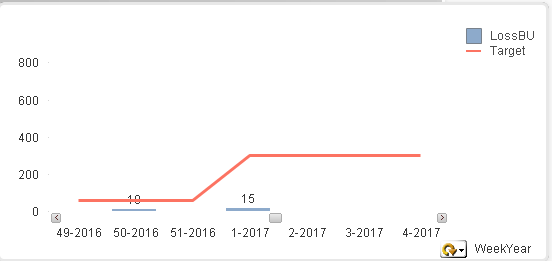
While generating master calendar you're using min(created) & max(created) from the Mytable1 so master calendar is ignore 1/1/2015 which is not present in the Mytable1 and this is the reason the year/month/week-year is not having any values in the chart and line looks weird.
Share the excel files you're using so that I can try to help you.
Thanks,
Shan S
- Mark as New
- Bookmark
- Subscribe
- Mute
- Subscribe to RSS Feed
- Permalink
- Report Inappropriate Content
There is supposed to be an other excel file.
But it's not useful for this particular case.
Anyway thank you a lot
- Mark as New
- Bookmark
- Subscribe
- Mute
- Subscribe to RSS Feed
- Permalink
- Report Inappropriate Content
can you upload the Sample.XLSX you have used in the sample application.
Thanks,
Shan S
- « Previous Replies
-
- 1
- 2
- Next Replies »