Unlock a world of possibilities! Login now and discover the exclusive benefits awaiting you.
- Qlik Community
- :
- All Forums
- :
- QlikView App Dev
- :
- Using Aggr and Concat inside a set analysis expres...
- Subscribe to RSS Feed
- Mark Topic as New
- Mark Topic as Read
- Float this Topic for Current User
- Bookmark
- Subscribe
- Mute
- Printer Friendly Page
- Mark as New
- Bookmark
- Subscribe
- Mute
- Subscribe to RSS Feed
- Permalink
- Report Inappropriate Content
Using Aggr and Concat inside a set analysis expression
Hi Qlik folks,
I am having some hard time in writing a Set analysis expression which involves Aggr and CONCAT aggregation functions. Please let me if my requirement can be achieved using a set analysis expression or if I need to change my approach to handle this.
My Requirement:
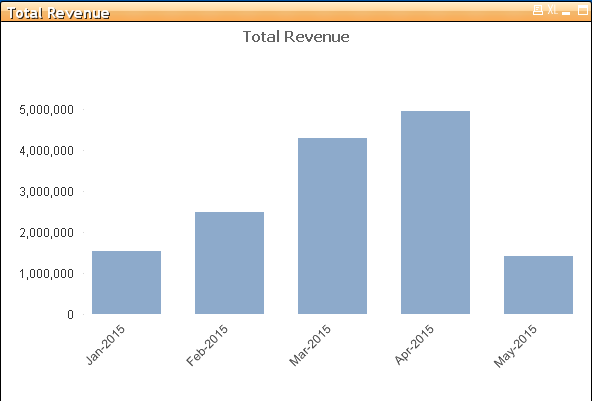
I need to show Sum of revenue for all the patients whose ScriptFlag =1 grouped for each month (as shown in image above).
For example, for month of Jan-2015, I need to show Revenue for all patients whose Script Flag =1 for Jan-2015
Dimenison = MonthYear
Expression = Sum ({<PatKey = {$(= Aggr(concat(DISTINCT{<ScriptFlag={1}>} PatKey,','),MonthYear))}>}Revenue)
This expression returns all zeroes when I show it in a table.
Please help me in getting into right approach to get my requirement.
Thank you
Teja
- Mark as New
- Bookmark
- Subscribe
- Mute
- Subscribe to RSS Feed
- Permalink
- Report Inappropriate Content
Try this for your expression:
= Sum ({<PatKey = {"$(= Aggr(concat(DISTINCT{<ScriptFlag={1}>} PatKey,','),MonthYear))"}>}Revenue)
Chances are that it still might not work, in which case I would check it the Aggr is working or not by putting
= Aggr(concat(DISTINCT{<ScriptFlag={1}>} PatKey,','),MonthYear) in a text box to see if the Aggr(Concat( ...)) is giving the result you were hoping to get....
If it isn't then you need to fix it, but if does I would need to take a look at your application to give you a better expression.
HTH
Best,
Sunny
- Mark as New
- Bookmark
- Subscribe
- Mute
- Subscribe to RSS Feed
- Permalink
- Report Inappropriate Content
As you have MonthYear as dimension, a simple Sum ({<ScriptFlag={1}>} Revenue) does not return what you need?
- Mark as New
- Bookmark
- Subscribe
- Mute
- Subscribe to RSS Feed
- Permalink
- Report Inappropriate Content
Hi,
=Sum ({<ScriptFlag={1}>} Revenue) does not return the result that I am looking for because,
it calculates revenue for all the patients whose ScriptFlag = 1 for selected period and then groups it by month
but I need to pick patients whose ScriptFlag =1 for each month (which is Dimension in this case) separately and calculate the revenue for these patients.
for example, a patient whose script flag =1 in Jan should not be included for revenue calculation in Feb even though there are any records for that patients in Feb.
I can try to explain my requirement again if its still not clear enough.
- Mark as New
- Bookmark
- Subscribe
- Mute
- Subscribe to RSS Feed
- Permalink
- Report Inappropriate Content
Hi,
= Sum ({<PatKey = {"$(= Aggr(concat(DISTINCT{<ScriptFlag={1}>} PatKey,','),MonthYear))"}>}Revenue) - This expression did not change the result. this still doesn't return anything.
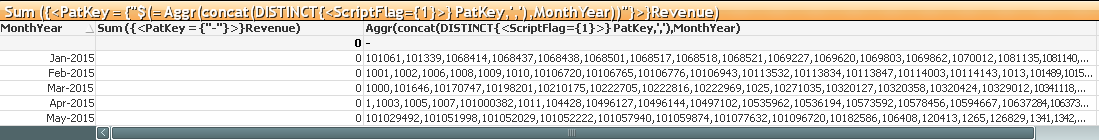
= Aggr(concat(DISTINCT{<ScriptFlag={1}>} PatKey,','),MonthYear) in a text box returns null which I guess is because it cannot group by month in a text box, but If I use this expression in a straight table using MonthYear as Dimension, I get the Concatenated PatNbrs as expected grouped for each month. But, I need the revenue for these PatNbrs grouped by Month.
I guess, QV doesnt group the data twice in a single Object (Here it should aggregate once to get required PatNbrs for each Month and then using this result it should calculate the revenue for each month for those PatNbrs)
This Image might give some idea on what I am talking about -
- Mark as New
- Bookmark
- Subscribe
- Mute
- Subscribe to RSS Feed
- Permalink
- Report Inappropriate Content
Try this in a text box:
=Concat({<ScriptFlag={1}>}Aggr(concat(DISTINCT{<ScriptFlag={1}>} PatKey,','),MonthYear), ',') If it gives you a concatenated list of all then try this for your final expression:
= Sum ({<PatKey = {"$(=Concat({<ScriptFlag={1}>}Aggr(concat(DISTINCT{<ScriptFlag={1}>} PatKey,','),MonthYear), ','))"}>}Revenue)
Best,
Sunny
- Mark as New
- Bookmark
- Subscribe
- Mute
- Subscribe to RSS Feed
- Permalink
- Report Inappropriate Content
=Concat({<ScriptFlag={1}>}Aggr(concat(DISTINCT{<ScriptFlag={1}>} PatKey,','),MonthYear), ',') in a text box returns the result which is concatenation of PatNbrs for all the months in selected period.
=Sum ({<PatKey = {$(=Concat({<ScriptFlag={1}>}Aggr(concat(DISTINCT{<ScriptFlag={1}>} PatKey,','),MonthYear), ','))}>}Revenue) works in straight table but result is not what I am looking for. This returns the same result as i get for Sum({<PatKey =P ({<ScriptFlag={1}>}PatKey)>}Revenue).
I do not want Concatenated PatNbrs from Feb to be included in calculation of revenue for Jan and vice versa.
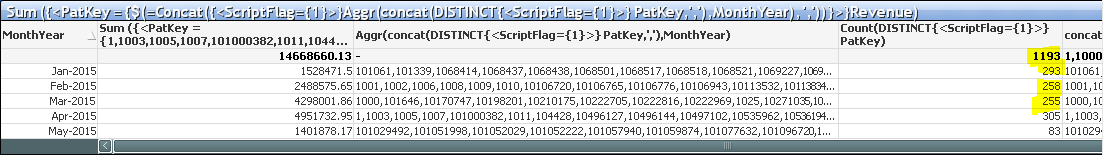
As you can see in above image, I want revenue of only those 293 PatNbrs for Jan, 258 PatNbrs for Feb and so on. Right now it is calculating revenue for all 1193 PatNbrs and then grouping it for each month which actually gives different results from what I am expecting.
- Mark as New
- Bookmark
- Subscribe
- Mute
- Subscribe to RSS Feed
- Permalink
- Report Inappropriate Content
Set analysis is calculated once per chart. So once a concatenated list if prepared, it is used throughout the chart. I think there might be a easier way to do this using flags, but for that you will have to share a sample to look at.
Best,
Sunny
- Mark as New
- Bookmark
- Subscribe
- Mute
- Subscribe to RSS Feed
- Permalink
- Report Inappropriate Content
Good Morning!
I understood your problem and I'm going through the same problem.
Did you solve it?
If you have succeeded please can you help me by passing on how did you solve it?
Thank you!
Hug!