Unlock a world of possibilities! Login now and discover the exclusive benefits awaiting you.
- Qlik Community
- :
- All Forums
- :
- QlikView App Dev
- :
- Using output(total) of one chart in another Straig...
- Subscribe to RSS Feed
- Mark Topic as New
- Mark Topic as Read
- Float this Topic for Current User
- Bookmark
- Subscribe
- Mute
- Printer Friendly Page
- Mark as New
- Bookmark
- Subscribe
- Mute
- Subscribe to RSS Feed
- Permalink
- Report Inappropriate Content
Using output(total) of one chart in another Straight table?
This is my table
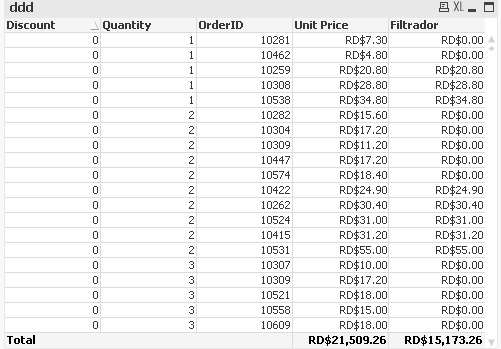
Filtrador = if(unitprice < 20, 0, unitprice)
------------------------------Now let's go to the nexttable
And then I have another table with this :
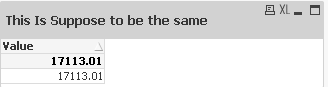
I calculate the field value using the following:
Value = sum(if(UnitPrice < 20, 0,UnitPrice))
I want to get exactly the same value that I have for Filtrador. I also attachedd the whole Document, I hope someone can help me with this, I really need it.
- Mark as New
- Bookmark
- Subscribe
- Mute
- Subscribe to RSS Feed
- Permalink
- Report Inappropriate Content
In your left straight table you're using =if(UnitPrice<20, 0,UnitPrice) as expression. Since you don't specify an aggregation function QV applies the default aggregation function, i.e. the only() function. The only function can only return a value if there is only one possible value.
If you scroll down the left straight table you will notice that some rows don't have a value, but a -. That's because there are several possible UnitPrices, so the only function cannot return only one value. Which value would be the correct one? That cannot be determined so the only function can't return a value. You can see this if you add all the fields in a table box and then select for example OrderID 10497. You'll see there are two UnitPrices.
If you use instead the same expression as in straight table on the right, sum(if(UnitPrice<20, 0,UnitPrice)), then you will get the correct total.
talk is cheap, supply exceeds demand