Unlock a world of possibilities! Login now and discover the exclusive benefits awaiting you.
- Qlik Community
- :
- All Forums
- :
- QlikView App Dev
- :
- Validation of planning
- Subscribe to RSS Feed
- Mark Topic as New
- Mark Topic as Read
- Float this Topic for Current User
- Bookmark
- Subscribe
- Mute
- Printer Friendly Page
- Mark as New
- Bookmark
- Subscribe
- Mute
- Subscribe to RSS Feed
- Permalink
- Report Inappropriate Content
Validation of planning
Hello.
I have a table with sales plans and the fact of sales for a certain period.
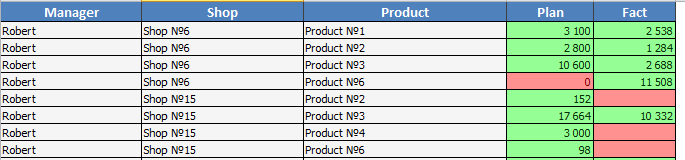
Each manager has planned a sales plan in the context of a shop-product. I want to evaluate the quality of management planning.
For this, I estimate the correctness of the plans for each combination Shop-Product.
If the deviation is less than 10%, I put 1 score, if from 10% to 20% - 0.9, if from 20% to 30% - 0.75, from 30% to 50% - 0.6, if from 50 % to 70% - 0.3 and if more than 70% - 0.
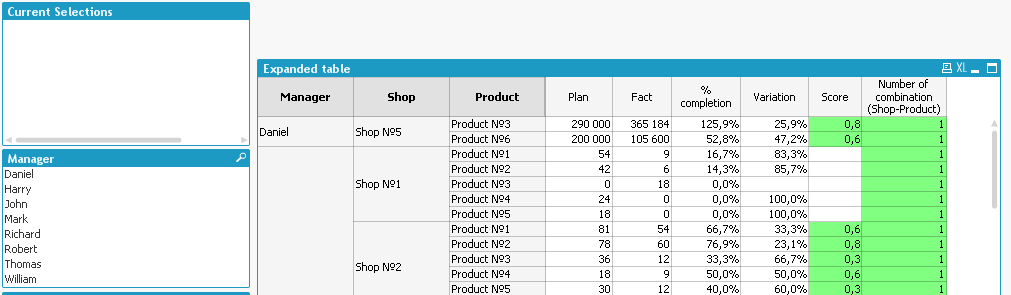
The result is the same:
But I want to see a summary of the managers. To do this, I have to export the data to Excel and make a summary pivot table there.
For example:
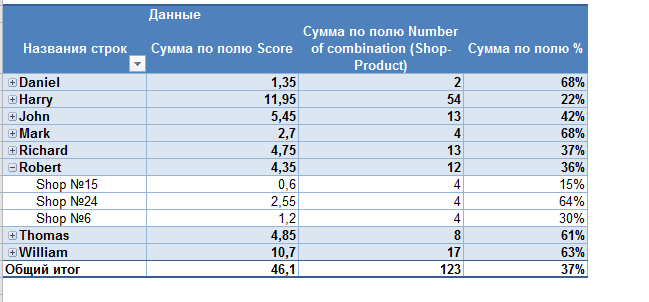
Please tell me if it is possible to make such a summary table in QlikView?
- Mark as New
- Bookmark
- Subscribe
- Mute
- Subscribe to RSS Feed
- Permalink
- Report Inappropriate Content
I understand this task can not be realized in QlikView?