Unlock a world of possibilities! Login now and discover the exclusive benefits awaiting you.
- Qlik Community
- :
- All Forums
- :
- QlikView App Dev
- :
- Re: Venn Diagram chart
- Subscribe to RSS Feed
- Mark Topic as New
- Mark Topic as Read
- Float this Topic for Current User
- Bookmark
- Subscribe
- Mute
- Printer Friendly Page
- Mark as New
- Bookmark
- Subscribe
- Mute
- Subscribe to RSS Feed
- Permalink
- Report Inappropriate Content
Venn Diagram chart
Hi Guys,
This is first time i'm working on extension objects, I have a requirement where i have to create Venn diagram chart in Qlikview. Please share me your ideas on it. This Venn Diagram chart should worked for N series of circles(Dynamic Chart)
- « Previous Replies
-
- 1
- 2
- Next Replies »
- Mark as New
- Bookmark
- Subscribe
- Mute
- Subscribe to RSS Feed
- Permalink
- Report Inappropriate Content
Hi, Dee.
QlikView doesn't have Venn Diagrams.
However, you can look for Google API extension which you can pull in. (just search for google api venn diagram). The downside of this though is that it relies on Google supporting this. As it gets pulled in as an image you don't have the full range of QlikView functionality you would expect from a chart.
Regards,
Neil.
- Mark as New
- Bookmark
- Subscribe
- Mute
- Subscribe to RSS Feed
- Permalink
- Report Inappropriate Content
Try using google API. Refer this document Venn Diagram in Qlikview using google chart api
- Mark as New
- Bookmark
- Subscribe
- Mute
- Subscribe to RSS Feed
- Permalink
- Report Inappropriate Content
Google API will be the way to go, but the only pitfall here is that it allows for only three circles. Not sure I if there is anything else that would allow for N circles, but I would be curious to know if there is something out there.
Best,
Sunny
- Mark as New
- Bookmark
- Subscribe
- Mute
- Subscribe to RSS Feed
- Permalink
- Report Inappropriate Content
- Mark as New
- Bookmark
- Subscribe
- Mute
- Subscribe to RSS Feed
- Permalink
- Report Inappropriate Content
Hi,
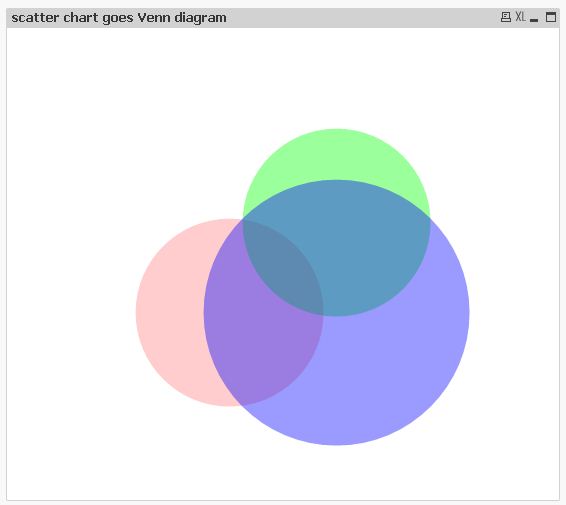
I guess it should be possible without extensions or external plot apis to create a Venn diagram using a scatter chart and some expressions to calculate bubble positions and sizes.
hope this helps
regards
Marco
- Mark as New
- Bookmark
- Subscribe
- Mute
- Subscribe to RSS Feed
- Permalink
- Report Inappropriate Content
Wow, this looks much better than Google Api's version of the Venn Diagram. I am amazed how this method has never been mentioned on the community before.
Thanks for sharing this Marco Wedel
Best,
Sunny
- Mark as New
- Bookmark
- Subscribe
- Mute
- Subscribe to RSS Feed
- Permalink
- Report Inappropriate Content
Hi Marco,
Do you have expressions to calculate bubble positions, in case we have buble sizes and also we know the intersection rates for bubbles? For example, let's say
B1 = 100, B2 = 80, B3 = 20, B1B2 = 80, B1B3 = 20, B2B3 = 20 and B1B2B3 = 20
Thanks,
- Mark as New
- Bookmark
- Subscribe
- Mute
- Subscribe to RSS Feed
- Permalink
- Report Inappropriate Content
Is there way, we can so the value as well for each area of the Vann diagram?
- Mark as New
- Bookmark
- Subscribe
- Mute
- Subscribe to RSS Feed
- Permalink
- Report Inappropriate Content
Hi,
I also want to implement the Vann diagram i qlikview . So I followed your answers and these guides:
Venn Diagram in Qlikview using google chart api
Somehow, this is what i get finally:
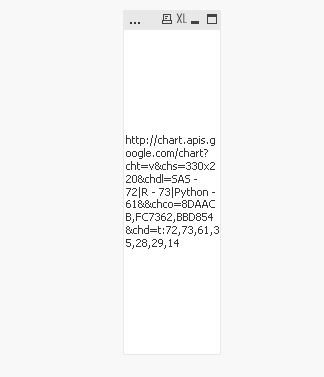
I assume the problem is in my expression. but I don't know where :
='http://chart.apis.google.com/chart?cht=v&chs=330x220&chdl=SAS - '&$(vS)&'|R - '&$(vR)&'|Python - '&$(vP)&'&&chco=8DAACB,FC7362,BBD854&chd=t:'
&$(vS)&','&$(vR)&','&$(vP)&','&$(vSR)&','&$(vSP)&','&$(vRP)&','&$(vSRP)
Thanks for any help:)
- « Previous Replies
-
- 1
- 2
- Next Replies »