Unlock a world of possibilities! Login now and discover the exclusive benefits awaiting you.
- Qlik Community
- :
- All Forums
- :
- QlikView App Dev
- :
- Re: Visual Cues for Annual Subtotal in a Pivot Tab...
- Subscribe to RSS Feed
- Mark Topic as New
- Mark Topic as Read
- Float this Topic for Current User
- Bookmark
- Subscribe
- Mute
- Printer Friendly Page
- Mark as New
- Bookmark
- Subscribe
- Mute
- Subscribe to RSS Feed
- Permalink
- Report Inappropriate Content
Visual Cues for Annual Subtotal in a Pivot Table
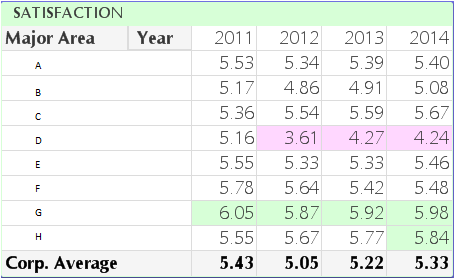
I'm trying to identify the ratings that are plus or minus 10% of the corporate average for each year in a pivot table. Both the Major Area and the Year are dimensions in the table.
The expressions I'm using for the visual cue for UPPER is Avg(Rating)*1.1 to highlight in green and for LOWER is Avg(Rating)*.90 to highlight in red.
My problem is that the ratings are highlighted based on the corporate average ratings for ALL the years versus the corporate average rating for EACH year. (For example, 5.64 and 5.67 should also be highlighted in green in year 2012)
What is the proper expression to highlight cells based on the yearly corporate average versus the average of all the years? Thank you!
- Tags:
- visual_cues
- « Previous Replies
-
- 1
- 2
- Next Replies »
Accepted Solutions
- Mark as New
- Bookmark
- Subscribe
- Mute
- Subscribe to RSS Feed
- Permalink
- Report Inappropriate Content
The expression you specify in Visual Cue is not aware of the dimensions so Year and Major Area are not considered at all - that is why you get the total corporate for all years.
However you could achieve what you want by abandoning the Visual Cues tab and go to your Expressions tab - select your expression and expand the plus to the left of the expression so you will find "Background Color" - select this and then you will have a corresponding Definition on the right where you could put your expression. This expression will be evaluated in context instead of out of context as with Visual Cues.
So the Definition has to look something like this:
If( Avg( Rating ) > Avg( TOTAL <Year> Rating ) *1.1 , Green(30) , If ( Avg( Rating ) < Avg( TOTAL <Year> Rating ) * 0.9 , Red(30) ) )
- Mark as New
- Bookmark
- Subscribe
- Mute
- Subscribe to RSS Feed
- Permalink
- Report Inappropriate Content
Try: Avg(total <Year> Rating)
- Marcus
- Mark as New
- Bookmark
- Subscribe
- Mute
- Subscribe to RSS Feed
- Permalink
- Report Inappropriate Content
not sure if it will work but have you tried with total ?
Avg(total<Year>Rating)*1.1
- Mark as New
- Bookmark
- Subscribe
- Mute
- Subscribe to RSS Feed
- Permalink
- Report Inappropriate Content
I did try Avg(TOTAL<Year>Rating)*1.1 and it did not work (same result as before)
- Mark as New
- Bookmark
- Subscribe
- Mute
- Subscribe to RSS Feed
- Permalink
- Report Inappropriate Content
I did try Avg(TOTAL<Year>Rating)*1.1 and it did not work (same result as before)
- Mark as New
- Bookmark
- Subscribe
- Mute
- Subscribe to RSS Feed
- Permalink
- Report Inappropriate Content
maybe by using bottom
bottom([ total ] expression [ , offset [,n ]])
Returns the value of expression evaluated with the chart's dimension values as they appear on the last row of the current column segment in a table or, in the case of bitmap charts, in the chart's straight table equivalent.
If the chart is one-dimensional or if the expression is preceded by the total qualifier, the current column segment is always equal to the entire column.
If the table or table equivalent has multiple vertical dimensions, the current column segment will include only rows with the same values as the current row in all dimension columns except for the column showing the last dimension in the inter field sort order. The inter field sort order for pivot tables is defined simply by the order of the dimensions from left to right. For other chart types this can be manipulated in the Chart Properties: Sort dialog.
Specifying an offset greater than 1 lets you move the evaluation of expression up to rows above the bottom row. A negative offset number will actually make the bottom function equivalent to a top function with the corresponding positive offset number. Recursive calls will return NULL.
By specifying a third parameter n greater than 1, the function will return not one but a range of n values, one for each of the last n rows of the current column segment. In this form, the function can be used as an argument to any of the special Chart Range Functions.
Examples:
bottom( sum( Sales ))
bottom( sum( Sales ), 2 )
bottom( total sum( Sales ))
- Mark as New
- Bookmark
- Subscribe
- Mute
- Subscribe to RSS Feed
- Permalink
- Report Inappropriate Content
Ramon, unfortunately, the bottom function didn't work either. Thanks for
trying!
Holly
This message is intended for use only by the person(s) addressed above and
may contain privileged and confidential information. Disclosure or use of
this message by any other person is strictly prohibited. If this message
is received in error, please notify the sender immediately and delete this
message.
- Mark as New
- Bookmark
- Subscribe
- Mute
- Subscribe to RSS Feed
- Permalink
- Report Inappropriate Content
could you share an example ?
- Mark as New
- Bookmark
- Subscribe
- Mute
- Subscribe to RSS Feed
- Permalink
- Report Inappropriate Content
The expression you specify in Visual Cue is not aware of the dimensions so Year and Major Area are not considered at all - that is why you get the total corporate for all years.
However you could achieve what you want by abandoning the Visual Cues tab and go to your Expressions tab - select your expression and expand the plus to the left of the expression so you will find "Background Color" - select this and then you will have a corresponding Definition on the right where you could put your expression. This expression will be evaluated in context instead of out of context as with Visual Cues.
So the Definition has to look something like this:
If( Avg( Rating ) > Avg( TOTAL <Year> Rating ) *1.1 , Green(30) , If ( Avg( Rating ) < Avg( TOTAL <Year> Rating ) * 0.9 , Red(30) ) )
- Mark as New
- Bookmark
- Subscribe
- Mute
- Subscribe to RSS Feed
- Permalink
- Report Inappropriate Content
Petter, brilliant! That did the trick... thanks for clarifying the issue
and providing the solution!
Holly
This message is intended for use only by the person(s) addressed above and
may contain privileged and confidential information. Disclosure or use of
this message by any other person is strictly prohibited. If this message
is received in error, please notify the sender immediately and delete this
message.
- « Previous Replies
-
- 1
- 2
- Next Replies »