Unlock a world of possibilities! Login now and discover the exclusive benefits awaiting you.
- Qlik Community
- :
- All Forums
- :
- QlikView App Dev
- :
- Visual Cues for Annual Subtotal in a Pivot Table
- Subscribe to RSS Feed
- Mark Topic as New
- Mark Topic as Read
- Float this Topic for Current User
- Bookmark
- Subscribe
- Mute
- Printer Friendly Page
- Mark as New
- Bookmark
- Subscribe
- Mute
- Subscribe to RSS Feed
- Permalink
- Report Inappropriate Content
Visual Cues for Annual Subtotal in a Pivot Table
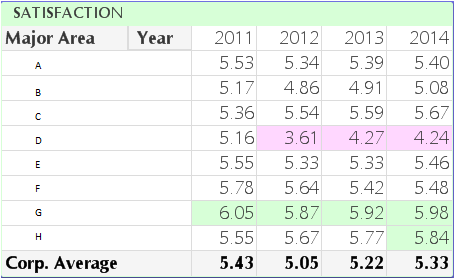
I'm trying to identify the ratings that are plus or minus 10% of the corporate average for each year in a pivot table. Both the Major Area and the Year are dimensions in the table.
The expressions I'm using for the visual cue for UPPER is Avg(Rating)*1.1 to highlight in green and for LOWER is Avg(Rating)*.90 to highlight in red.
My problem is that the ratings are highlighted based on the corporate average ratings for ALL the years versus the corporate average rating for EACH year. (For example, 5.64 and 5.67 should also be highlighted in green in year 2012)
What is the proper expression to highlight cells based on the yearly corporate average versus the average of all the years? Thank you!
- Tags:
- visual_cues
- « Previous Replies
-
- 1
- 2
- Next Replies »
- Mark as New
- Bookmark
- Subscribe
- Mute
- Subscribe to RSS Feed
- Permalink
- Report Inappropriate Content
Glad to help. Please close the thread by marking it as answered 
- Mark as New
- Bookmark
- Subscribe
- Mute
- Subscribe to RSS Feed
- Permalink
- Report Inappropriate Content
I was kind of hoping to score some points for my effort. But since you marked the question as "Assumed Answered" you didn't credit anyone for helping you to solve this... 
- Mark as New
- Bookmark
- Subscribe
- Mute
- Subscribe to RSS Feed
- Permalink
- Report Inappropriate Content
Petter, sorry, I thought that was the way to close the thread. What
should I do? I didn't see any other way of "closing" this. I certainly
want you to receive credit for your solution... please tell me what I
should do.
Holly
- Mark as New
- Bookmark
- Subscribe
- Mute
- Subscribe to RSS Feed
- Permalink
- Report Inappropriate Content
I think you pressed "Mark as Correct" at one of your comments or at your question instead of pressing the "Mark as Correct" on my comment.
There should be an gray button that says "Unmark as Correct" in the place where you marked it initially as correct. If you press that you could reassign it.
br
Petter S
- Mark as New
- Bookmark
- Subscribe
- Mute
- Subscribe to RSS Feed
- Permalink
- Report Inappropriate Content
Thank you very much for such simple solution.
- « Previous Replies
-
- 1
- 2
- Next Replies »