Unlock a world of possibilities! Login now and discover the exclusive benefits awaiting you.
- Qlik Community
- :
- All Forums
- :
- QlikView App Dev
- :
- Want to show data from Jan 2015 to current month
- Subscribe to RSS Feed
- Mark Topic as New
- Mark Topic as Read
- Float this Topic for Current User
- Bookmark
- Subscribe
- Mute
- Printer Friendly Page
- Mark as New
- Bookmark
- Subscribe
- Mute
- Subscribe to RSS Feed
- Permalink
- Report Inappropriate Content
Want to show data from Jan 2015 to current month
Hi All,
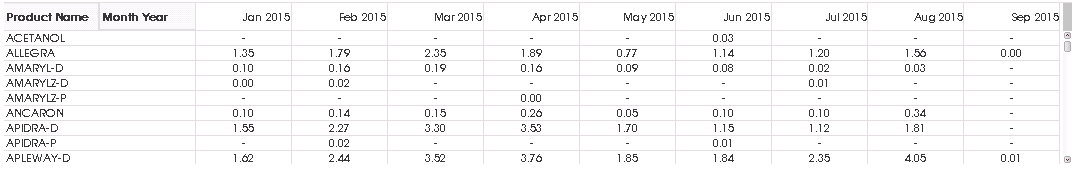
I want to show data in straight table default from Jan to current Month of current year i.e. Jan 2015 to Sep 2015.
I am having Product as dimension & don't want to use MonthYear as dimension please help me to achive this also
attached sample qvw file for reference.
I am having following field Year,Month,MonthYear column in Calender table in data model@
Same result shown in image want to achive by removing MonthYear field from dimension in pivot table
- Mark as New
- Bookmark
- Subscribe
- Mute
- Subscribe to RSS Feed
- Permalink
- Report Inappropriate Content
=Sum({<[Month Year] = {">=$(=YearStart(Today()))<=$(=MonthEnd(Today()))"}>}[DTL Sum])/$(vTotal)*100
- Mark as New
- Bookmark
- Subscribe
- Mute
- Subscribe to RSS Feed
- Permalink
- Report Inappropriate Content
I don't understand what you are asking. If you don't want MonthYear as dimension, simply remove it from the chart. However this will not look like your image (which has MonthYear as a dimension)
- Mark as New
- Bookmark
- Subscribe
- Mute
- Subscribe to RSS Feed
- Permalink
- Report Inappropriate Content
Hi Rahul,
Try:
SUM({<MonthYear={">=$(=Date(yearstart(today()),'MMM-YY'))<=$(=Max(MonthYear))"}>} Metric)
- Mark as New
- Bookmark
- Subscribe
- Mute
- Subscribe to RSS Feed
- Permalink
- Report Inappropriate Content
Hi Jonathan,
I want to achive result in same format shown in image.
1) if i am having data for year 2014 & 2015 then it should display
data only from Jan 2015 to Current month Sep 2015 only. Means If there is data for 2014 then by default it should not show data of 2014 instead it should show data Jan 2015 to Current month Sep 2015.
2)On selection of 2014 it should show last 13 month data.
Note: Currently No data available for 2014 in DB which may come later.
- Mark as New
- Bookmark
- Subscribe
- Mute
- Subscribe to RSS Feed
- Permalink
- Report Inappropriate Content
Hi Neetha,
Thanks for your reply
I implmented your solution & attached qvw file for referance.Now i want to show rolling 13 months data if i select Year 2014 please help me on this.
Thanks
Rahul