Unlock a world of possibilities! Login now and discover the exclusive benefits awaiting you.
- Qlik Community
- :
- All Forums
- :
- QlikView App Dev
- :
- Weighted median
- Subscribe to RSS Feed
- Mark Topic as New
- Mark Topic as Read
- Float this Topic for Current User
- Bookmark
- Subscribe
- Mute
- Printer Friendly Page
- Mark as New
- Bookmark
- Subscribe
- Mute
- Subscribe to RSS Feed
- Permalink
- Report Inappropriate Content
Weighted median
Can anyone suggest the best way to calculated a weighted median in QlikView
The data i have is in the following format.
Value, Weight
2, 3
7, 5
9, 5
13, 2
The weighted median is 7 as illustrated below.
2 2 2 7 7 7 7 7 9 9 9 9 9 13 13
Can anyone think of the best way to calculated this in QlikView?
Thanks
Matt
- Mark as New
- Bookmark
- Subscribe
- Mute
- Subscribe to RSS Feed
- Permalink
- Report Inappropriate Content
Hi again,
Regarding the script implementation I had something in mind like:
LOAD Median(Value) as YourMedian;
LOAD Value
INLINE [
    Value, Weight
    2, 3
    7, 5
    13, 1
    9, 5
]
While IterNo()<=Weight;
Marco
- Mark as New
- Bookmark
- Subscribe
- Mute
- Subscribe to RSS Feed
- Permalink
- Report Inappropriate Content
I think I don't like my solution anymore. 
Thanks for sharing the script solution. I will have to spend some more time understanding how IterNo() works. I have thought about using it, but never really put time to see what it is doing.
Thanks Marco.
- Mark as New
- Bookmark
- Subscribe
- Mute
- Subscribe to RSS Feed
- Permalink
- Report Inappropriate Content
Hi Matt,
try this quick backend solution:
- Test:
- NoConcatenate
- Load
- Value
- ,Weight
- While
- (Weight - IterNo())>=0;
- Load
- *
- INLINE [
- Value,Weight
- 2,3
- 7,5
- 9,5
- 13,2];
- Mark as New
- Bookmark
- Subscribe
- Mute
- Subscribe to RSS Feed
- Permalink
- Report Inappropriate Content
This is, great. I'm getting there
Now, let me change the question slightly. If instead of an integer for weight, I'm given a decimal or a percentage.
So, data look like this:
Value, Weight
2, 0.2
7, 0.333333
9, 0.333333
13, 0.133333
How to tackle this? Both the solutions above the the expression and the iterative load are great, but rely on whole numbers.
Thanks
Matt
- Mark as New
- Bookmark
- Subscribe
- Mute
- Subscribe to RSS Feed
- Permalink
- Report Inappropriate Content
Hi Matt,
first idea is to bring all Weight occurrences and calculate GCD (greatest common divisor) .
0.2 = 1/5 ->3
0.3333= 1/3 -> 5
0.1333 = 2/15 -> 2
beacuse GCD is 15
[Value,Weight
2,3
7,5
9,5
13,2]
Regards,
Ely
- Mark as New
- Bookmark
- Subscribe
- Mute
- Subscribe to RSS Feed
- Permalink
- Report Inappropriate Content
Thanks Ely,
I now have the data - and as I expected I receive the weights as a percentage, not a whole number.
What I now want to do is to
Order the list of values by value, and calculate the cumulative weight. Highlight the first value where the cumulative weight reaches over 50% of the total weight for the data set (this is the weighted median). Very much like how Sunny did this in the script, but I would like to do this as part of a straight table - or more ideally have a formula that returns the value straight off.
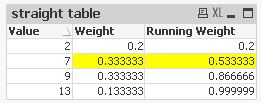
I have this straight table
Ordering the values by value, using the following formula to calculate the running total
Running Weight: =Rangesum(Above(TOTAL Sum(Weight),0,rowno(TOTAL)))
The 50% threshold, Median Threshold: =SUM(TOTAL Weight)/2
And a simple IF statement to highlight where the Running weight is greater than the threshold.
I would like to highlight the the first row where the threshold is broken (in this case Value = 7).
I'm thinking I need an AGGR expression and to use FirstSortedValue, but cannot get anything to work.
I appreciate everyone's help, thanks.
Matt
- Mark as New
- Bookmark
- Subscribe
- Mute
- Subscribe to RSS Feed
- Permalink
- Report Inappropriate Content
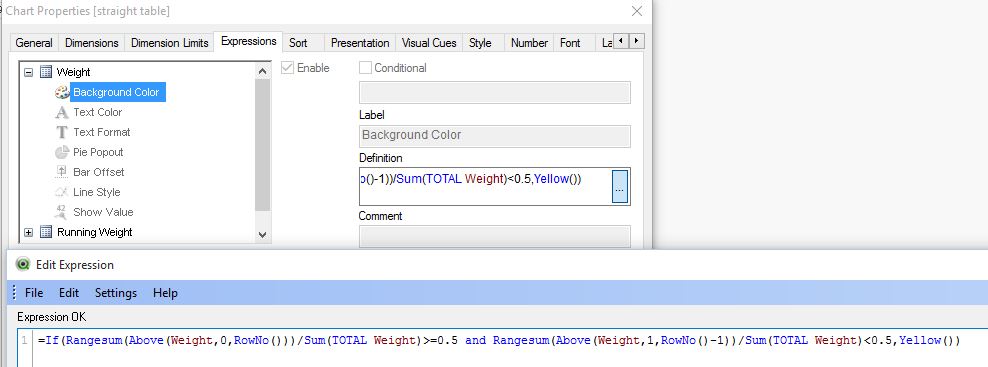
Hi,
maybe using a background colour expression like:
=If(Rangesum(Above(Weight,0,RowNo()))/Sum(TOTAL Weight)>=0.5 and Rangesum(Above(Weight,1,RowNo()-1))/Sum(TOTAL Weight)<0.5,Yellow())
hope this helps
regards
Marco
- Mark as New
- Bookmark
- Subscribe
- Mute
- Subscribe to RSS Feed
- Permalink
- Report Inappropriate Content
Thanks Marco
That gives me the chart I was after. Great.
Any thoughts on how to just get the answer in an expression, without the need for a straight table? Some kind of aggr function?
Matt
- Mark as New
- Bookmark
- Subscribe
- Mute
- Subscribe to RSS Feed
- Permalink
- Report Inappropriate Content
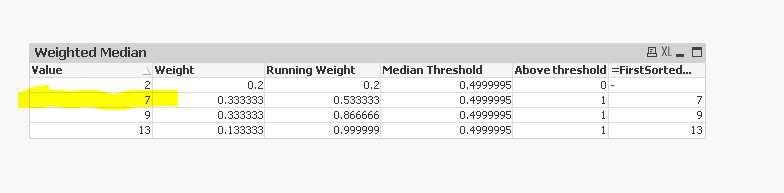
Hi,
maybe like:
Aggr(If(Rangesum(Above(Weight,0,RowNo()))/Sum(TOTAL Weight)>=0.5 and Rangesum(Above(Weight,1,RowNo()-1))/Sum(TOTAL Weight)<0.5,Value),Value)

hope this helps as well
regards
Marco
- Mark as New
- Bookmark
- Subscribe
- Mute
- Subscribe to RSS Feed
- Permalink
- Report Inappropriate Content
Thanks for everyone's help, all answers very useful. One thing to be aware of especially with the final aggregation is order that the data is loaded into qlikview, the original order is what's important here, not any subsequent sorting in the script. I had to fool qlikview by renaming fields after sorting to get consistent sensible answers.