Unlock a world of possibilities! Login now and discover the exclusive benefits awaiting you.
- Qlik Community
- :
- All Forums
- :
- QlikView App Dev
- :
- Whats the best Chart to use........
- Subscribe to RSS Feed
- Mark Topic as New
- Mark Topic as Read
- Float this Topic for Current User
- Bookmark
- Subscribe
- Mute
- Printer Friendly Page
- Mark as New
- Bookmark
- Subscribe
- Mute
- Subscribe to RSS Feed
- Permalink
- Report Inappropriate Content
Whats the best Chart to use........
Hi,
What is the best Chart to use for the following requirements:
A line graph is required to display two dimensions 'date' and 'site'
3 different expressions are also required to be displayed, act. avg. target.
Thanks,
Gregg
Accepted Solutions
- Mark as New
- Bookmark
- Subscribe
- Mute
- Subscribe to RSS Feed
- Permalink
- Report Inappropriate Content
Gregg,
Bit of a tricky one as Line Charts in Qlikview don't split out as they should unlike Bar Charts:
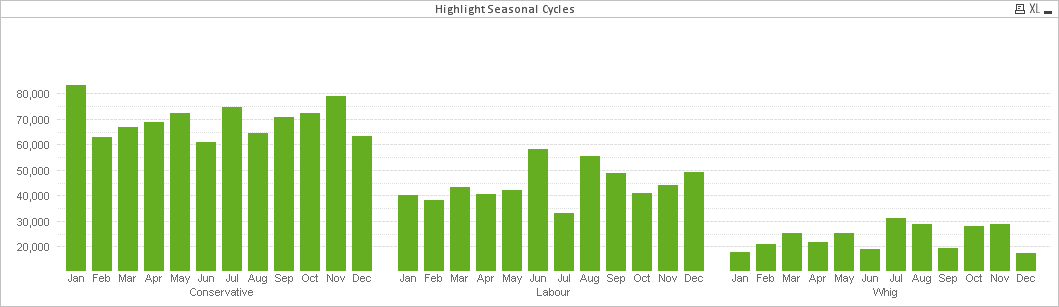
The nearest you can get with a Line Chart is to Trellis it - Using 'Site' and maintain Date as the dimension shown in the actual chart, you can then add as many Expressions as reuqired as below:

Hope that's of use. NB: it can take a little adjustment to get the Trellis settings to work properly.
All the best,
Matt - Visual Analytics Ltd
Qlikview Design Blog: http://QVDesign.wordpress.com
@QlikviewBI
- Mark as New
- Bookmark
- Subscribe
- Mute
- Subscribe to RSS Feed
- Permalink
- Report Inappropriate Content
I think best chart should be line chart with only one dimension at a time. You can use cyclic drill for Date and Site
- Mark as New
- Bookmark
- Subscribe
- Mute
- Subscribe to RSS Feed
- Permalink
- Report Inappropriate Content
Hi Vijay,
By using thecyclic drill would this mean that only the site OR date are visible at the one time?
I need both to be visible.
Regards,
Gregg
- Mark as New
- Bookmark
- Subscribe
- Mute
- Subscribe to RSS Feed
- Permalink
- Report Inappropriate Content
Gregg,
Bit of a tricky one as Line Charts in Qlikview don't split out as they should unlike Bar Charts:
The nearest you can get with a Line Chart is to Trellis it - Using 'Site' and maintain Date as the dimension shown in the actual chart, you can then add as many Expressions as reuqired as below:
Hope that's of use. NB: it can take a little adjustment to get the Trellis settings to work properly.
All the best,
Matt - Visual Analytics Ltd
Qlikview Design Blog: http://QVDesign.wordpress.com
@QlikviewBI
- Mark as New
- Bookmark
- Subscribe
- Mute
- Subscribe to RSS Feed
- Permalink
- Report Inappropriate Content
Hi Matthew,
Thanks for that.
I will work on this.
Is there a way to make both graphs bigger on screen when they are split out?
Thanks,
Gregg
- Mark as New
- Bookmark
- Subscribe
- Mute
- Subscribe to RSS Feed
- Permalink
- Report Inappropriate Content
Gregg,
For some reason Trellis Charts set to really stupid sizings.
I find that if you have a fairly static 'Trellis Dimension' (in your case site) then you can fix the number of rows and columns under Dimension > Trellis Settings - in my example it's 3 colums and a single row.
This does cause problems if you allow users to select across your Trellis dimension as it can throw the display out of sync.
All the best,
Matt - Visual Analytics Ltd
Qlikview Design Blog: http://QVDesign.wordpress.com
@QlikviewBI