Unlock a world of possibilities! Login now and discover the exclusive benefits awaiting you.
- Qlik Community
- :
- All Forums
- :
- QlikView App Dev
- :
- Why can't I suppress 0 values in my pivot table
- Subscribe to RSS Feed
- Mark Topic as New
- Mark Topic as Read
- Float this Topic for Current User
- Bookmark
- Subscribe
- Mute
- Printer Friendly Page
- Mark as New
- Bookmark
- Subscribe
- Mute
- Subscribe to RSS Feed
- Permalink
- Report Inappropriate Content
Why can't I suppress 0 values in my pivot table
Hello,
My demo xls is the (fake) output of my pivot table. I don't want to show Mrs Blue and Mrs Purple since they have 0 targets, however, I can't find out where to put the code to hide them.
The 'suppress zero option' doesn't work.
Help is appreciated, thank you!
Wouter Hollander
- « Previous Replies
-
- 1
- 2
- Next Replies »
Accepted Solutions
- Mark as New
- Bookmark
- Subscribe
- Mute
- Subscribe to RSS Feed
- Permalink
- Report Inappropriate Content
OK, so you want to suppress the row for AM_GROUP if there is no TARGET data for that AM_GROUP? If so, you could replace dimension AM_GROUP with this:
=aggr(if(sum(TARGET),AM_GROUP),AM_GROUP)
Unfortunately, that breaks the ability to navigate back up through the group. So I created a second chart with nothing but the dimension AM_GROUP and removed the caption, giving me the icon and the current field for the group and nothing else. I placed this on top of the original chart where it appears to be the label for the column. Might work well enough.
See attached.
- Mark as New
- Bookmark
- Subscribe
- Mute
- Subscribe to RSS Feed
- Permalink
- Report Inappropriate Content
Hi Wouter,
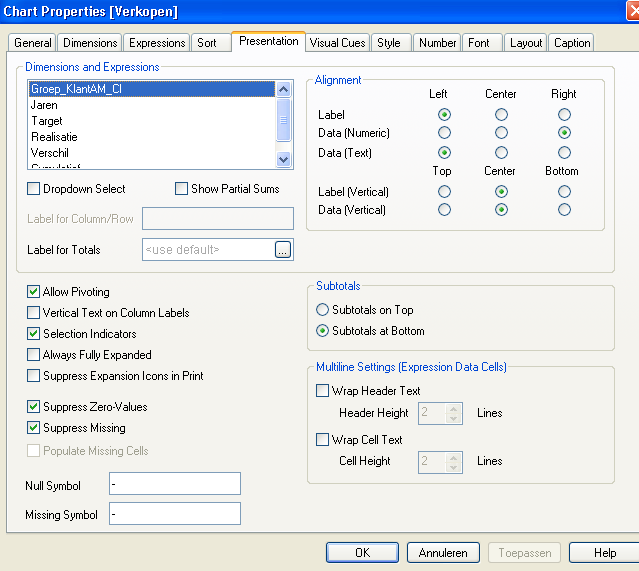
only a simple question: did you uncheck at the presentation tab (for all dims in your chart) : "Show all Values"
Regards, Roland
- Mark as New
- Bookmark
- Subscribe
- Mute
- Subscribe to RSS Feed
- Permalink
- Report Inappropriate Content
Hi Roland,
I can't select this option. I have added a screendump...
Thanks
Wouter
- Mark as New
- Bookmark
- Subscribe
- Mute
- Subscribe to RSS Feed
- Permalink
- Report Inappropriate Content
I used your excel sample and replaced field [1], [2] and [3] this way
LOAD am_ci,
 Periode,
 replace([1],0,Null()) AS [1],
 replace([2],0,Null()) AS [2],
 replace([3],0,Null()) AS [3],
 Total
FROM
The zero values are replaced by NULL values.
When building a chart with dimensions am_ci and Periode and expressions sum([1]), sum([2]), sum([3]), sum(Total), the lines for Mrs Blue and Mrs Purple are not shown.
- Mark as New
- Bookmark
- Subscribe
- Mute
- Subscribe to RSS Feed
- Permalink
- Report Inappropriate Content
Hi Mark,
Thanks for the answer, I have played with it and I can change the values from 0 to null, however I don't get them to suppress.
When I created a test file to add here it suddenly did work.
So, my feeling is, that I can't do this because of the other values that are present in the data. I have one BIG fact table, and besides 'OMZET' and ' TARGET' there are other values present there as well.
Attached a picture of my datamodel. Can you think of another solution?? Thanks in advance
Wouter
- Mark as New
- Bookmark
- Subscribe
- Mute
- Subscribe to RSS Feed
- Permalink
- Report Inappropriate Content
Hi Wouter,
sorry, what I did mean in my previous post was the dimension tab. See attached bit map. If it not as easy as this, don't hesitate to post a little sample app.
RR
- Mark as New
- Bookmark
- Subscribe
- Mute
- Subscribe to RSS Feed
- Permalink
- Report Inappropriate Content
Hi again,
I am in trouble with uploading the bitmap. Next try.....
RR
- Mark as New
- Bookmark
- Subscribe
- Mute
- Subscribe to RSS Feed
- Permalink
- Report Inappropriate Content
Hi Roland and Mark,
Thanks for trying to help.
Yes, I have all unchecked 'Show all values' for all dimensions.
I think it is because in the datamodel I have other values in that specific line. (Which I don't select).
Any other ideas? Or should I really try to make an example QVW ? (is difficult because of not being able to use real data of course).
- Mark as New
- Bookmark
- Subscribe
- Mute
- Subscribe to RSS Feed
- Permalink
- Report Inappropriate Content
Hi,
if you load data from Excel, there is a problem in recognition of NULL-cells, because Excel is sometimes storing some (unknown) information in empty cells. Thats why your data are not really NULL. I recommend to load only data with values:
Load field1, field2,field3,... from ...excel.xls ... where field1<>0 or field2<>0, or field3<>'' and so on
- Mark as New
- Bookmark
- Subscribe
- Mute
- Subscribe to RSS Feed
- Permalink
- Report Inappropriate Content
Hi Martina,
Thank you for thinking along.
However, it is loaded from a DWH. (excel file was only example).
Moreover, I only read targets with an amount. And the people and departments which are visible, don't have targets. So, they are visible in the lay-out because of other data, which is not used in the pivottable.
Well, I am curious what I can do..
Thanks!
Wouter
- « Previous Replies
-
- 1
- 2
- Next Replies »