Unlock a world of possibilities! Login now and discover the exclusive benefits awaiting you.
- Qlik Community
- :
- All Forums
- :
- QlikView App Dev
- :
- Will it be possible to not filter straight table d...
- Subscribe to RSS Feed
- Mark Topic as New
- Mark Topic as Read
- Float this Topic for Current User
- Bookmark
- Subscribe
- Mute
- Printer Friendly Page
- Mark as New
- Bookmark
- Subscribe
- Mute
- Subscribe to RSS Feed
- Permalink
- Report Inappropriate Content
Will it be possible to not filter straight table data on certain dimension
Hi,
I've requirement where a straight table data should not be filtered based on certain dimensions in the table, but filtered when certain other dimension from the straight table or dimensions from different charts on dashboard are selected.
This is related to dashboard information found in link How to sync behavior of two bar charts (Need help) and Input for search object appears quite far from object itself (appearance of search input cursor in desktop application is still an issue)
Headers from Straight Table chart are as seen in screen shot below.
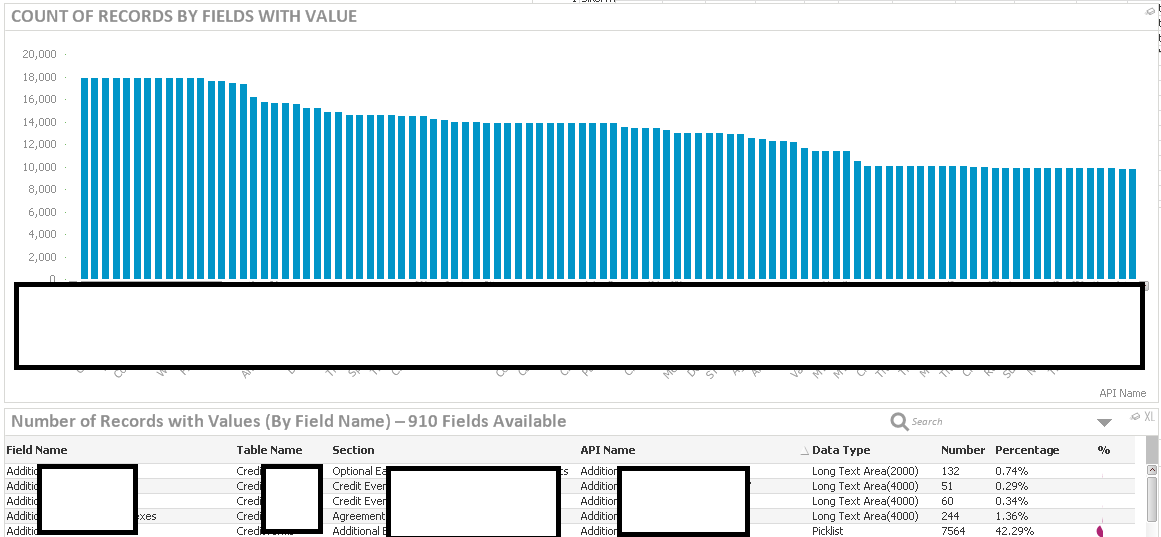 (Image1)
User has requested that all records in a straight table should be displayed even if any "Field Name" or "API Name" value is selected, it should filter only if a selection is made in "Section" Column or any selection done in the charts available on the dashboard (Charts can be seen in ).
One another challenge that I'm facing is that several charts are made visible when a particular API Name is selected in conjunction with Data Type Column. So now if selection is restricted for "API Name" column then I'm not sure how I can make those chart visible for the user.
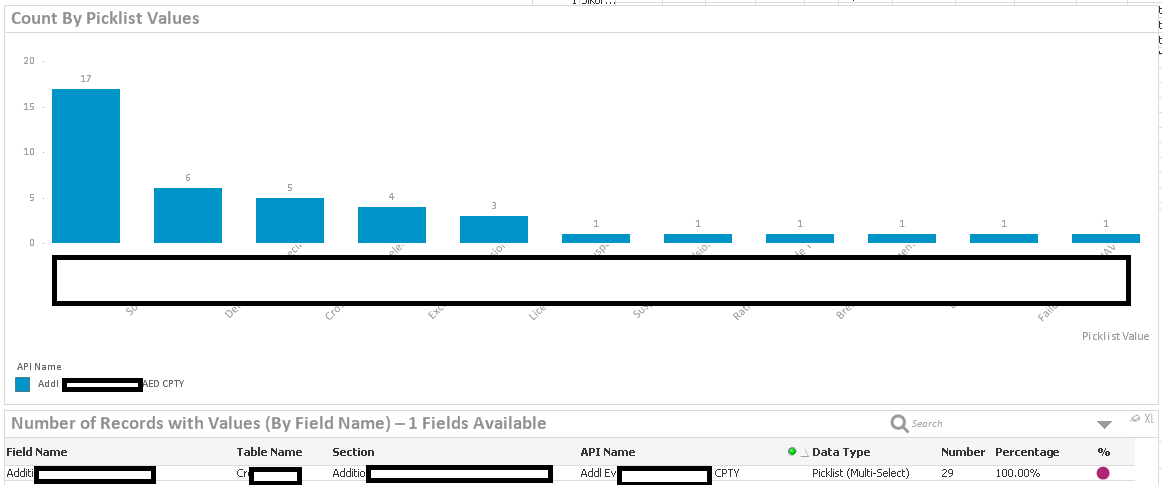 (Image2)
The chart in Image 2 is made visible in the same area as the bar chart seen in Image1 above.
Layout Condition is
If((WildMatch(MaxString({<[API Name]={'$(=$(vSelectedFieldName))'}>}[Data Type]),'Picklist*')) and GetSelectedCount([API Name]) = 1,1,0)
IF we are able to successfully achieve the filter behavior for straight table and chart visibility for an "API Name" of Picklist Data Type then the user will want the straight table to filter if some of the Picklist values of an API are selected.
Please not there are no list boxes on dashboard for value selection.
Let me know if you need any more clarification or information. Any help/guidance will be greatly appreciable.
Thanks,
Vijay
Accepted Solutions
- Mark as New
- Bookmark
- Subscribe
- Mute
- Subscribe to RSS Feed
- Permalink
- Report Inappropriate Content
Hello All,
Thanks for your inputs. I think I got my answer with the help from following discussion How to show all dimension values in straight table after selecting one?
So required change was in expression to have those dimension included in set analysis without any value for matching, thus it will retain all values of it.
Count({<
[Version]={'>0'},
[AT Doc Status]={'EDC*',Completed*'},
[API Name],
[Field Name],
[Table Name],
[Data Type]
>}
[AT ID])
- Mark as New
- Bookmark
- Subscribe
- Mute
- Subscribe to RSS Feed
- Permalink
- Report Inappropriate Content
You can achieve the filter behavior you are looking for with set analysis. Instead of using a $ as your modifier in the set you can use a 1. This will ignore all filters, now for the fields you with for the table to filter you on you'll include the following in the set. FieldName = $::FieldName. If you'd like to use the $ as the modifier you can also exclude the filters by doing FieldName = in the set.
Edit. After re-reading to show/hide the columns you could use a conditional on the dimension/expressions to show calculate if the condition is met.
- Mark as New
- Bookmark
- Subscribe
- Mute
- Subscribe to RSS Feed
- Permalink
- Report Inappropriate Content
I think it will help if you can provide a sample. If you have confidentiality concerns, you can look here to see if this helps them resolve those concerns
Preparing examples for Upload - Reduction and Data Scrambling
- Mark as New
- Bookmark
- Subscribe
- Mute
- Subscribe to RSS Feed
- Permalink
- Report Inappropriate Content
Hello All,
Thanks for your inputs. I think I got my answer with the help from following discussion How to show all dimension values in straight table after selecting one?
So required change was in expression to have those dimension included in set analysis without any value for matching, thus it will retain all values of it.
Count({<
[Version]={'>0'},
[AT Doc Status]={'EDC*',Completed*'},
[API Name],
[Field Name],
[Table Name],
[Data Type]
>}
[AT ID])