Unlock a world of possibilities! Login now and discover the exclusive benefits awaiting you.
- Qlik Community
- :
- All Forums
- :
- QlikView App Dev
- :
- Re: Working with dates
- Subscribe to RSS Feed
- Mark Topic as New
- Mark Topic as Read
- Float this Topic for Current User
- Bookmark
- Subscribe
- Mute
- Printer Friendly Page
- Mark as New
- Bookmark
- Subscribe
- Mute
- Subscribe to RSS Feed
- Permalink
- Report Inappropriate Content
Working with dates
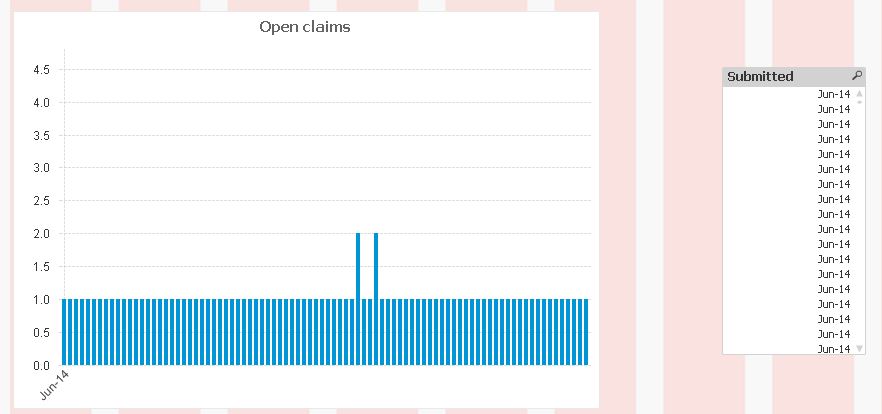
Hi I have this table with date field in format M/D/YYYY and I want to show it like MMM-YY in QlikView, I want to create it from the script so I'm simply doing this date(SUBMIT_DT,'MMM-YY') which gets me the right format, the problem is, it doesn't group together in charts / list box... look at the picture, how can I solve it without converting it to text (so I can sort it correctly)
Accepted Solutions
- Mark as New
- Bookmark
- Subscribe
- Mute
- Subscribe to RSS Feed
- Permalink
- Report Inappropriate Content
Hi oscar,
What do you mean by grouping?
is data duplicated?
Regards
Neetha
- Mark as New
- Bookmark
- Subscribe
- Mute
- Subscribe to RSS Feed
- Permalink
- Report Inappropriate Content
see attachment
- Mark as New
- Bookmark
- Subscribe
- Mute
- Subscribe to RSS Feed
- Permalink
- Report Inappropriate Content
Hi oscar,
What do you mean by grouping?
is data duplicated?
Regards
Neetha
- Mark as New
- Bookmark
- Subscribe
- Mute
- Subscribe to RSS Feed
- Permalink
- Report Inappropriate Content
Add below in your script
Date(MonthStart(Date#(SUBMIT_DT,'M/D/YYYY')),'MMM-YY') as Submitted
or
use below in your chart as a Calculated Dimension or you simply use to create a field in list box
Date(MonthStart(Date#(SUBMIT_DT,'M/D/YYYY')),'MMM-YY')
- Mark as New
- Bookmark
- Subscribe
- Mute
- Subscribe to RSS Feed
- Permalink
- Report Inappropriate Content
SIngle values in chart axis and list box, normally you can have multiple records with same value, but here they will appear just once
- Mark as New
- Bookmark
- Subscribe
- Mute
- Subscribe to RSS Feed
- Permalink
- Report Inappropriate Content
Use this on the date in the script:
Date(MonthStart(SUBMIT_DT), 'MMM-YY') as MonthYear,
- Mark as New
- Bookmark
- Subscribe
- Mute
- Subscribe to RSS Feed
- Permalink
- Report Inappropriate Content
Thanks, works like a charm 
- Mark as New
- Bookmark
- Subscribe
- Mute
- Subscribe to RSS Feed
- Permalink
- Report Inappropriate Content
THanks you! I'd wish I could mark two answers as correct, I appreciate your help!
- Mark as New
- Bookmark
- Subscribe
- Mute
- Subscribe to RSS Feed
- Permalink
- Report Inappropriate Content
LOAD Date(MonthName(SUBMIT_DT),'MMM-YY') as Submitted
Resident yoursource;