Unlock a world of possibilities! Login now and discover the exclusive benefits awaiting you.
- Qlik Community
- :
- All Forums
- :
- QlikView App Dev
- :
- Y axis in chart is barely showing
Options
- Subscribe to RSS Feed
- Mark Topic as New
- Mark Topic as Read
- Float this Topic for Current User
- Bookmark
- Subscribe
- Mute
- Printer Friendly Page
Turn on suggestions
Auto-suggest helps you quickly narrow down your search results by suggesting possible matches as you type.
Showing results for
Not applicable
2017-01-13
04:20 PM
- Mark as New
- Bookmark
- Subscribe
- Mute
- Subscribe to RSS Feed
- Permalink
- Report Inappropriate Content
Y axis in chart is barely showing
How do I show the entire Y-axis of my bar chart? please see pic attached.
Also, how do i get the yaxis line and x axis line to show in the graph? (the L shape  )
)
Thanks in advance.
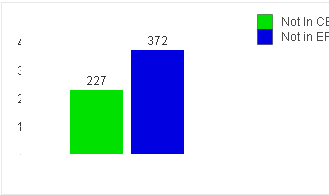
(pls note the legend was accidentally cropped by me, the y-axis where my issue is)
278 Views
1 Solution
Accepted Solutions
Anonymous
Not applicable
2017-01-13
04:47 PM
Author
- Mark as New
- Bookmark
- Subscribe
- Mute
- Subscribe to RSS Feed
- Permalink
- Report Inappropriate Content
Hold down ctrl+shift. Then you can size the different chart areas.
Applies to Qlikview 11.
196 Views
3 Replies
Anonymous
Not applicable
2017-01-13
04:47 PM
Author
- Mark as New
- Bookmark
- Subscribe
- Mute
- Subscribe to RSS Feed
- Permalink
- Report Inappropriate Content
Hold down ctrl+shift. Then you can size the different chart areas.
Applies to Qlikview 11.
197 Views
Not applicable
2017-01-13
04:49 PM
Author
- Mark as New
- Bookmark
- Subscribe
- Mute
- Subscribe to RSS Feed
- Permalink
- Report Inappropriate Content
that worked for the y axis numbers, do you know how to get the axis lines to show? thanks
196 Views
Anonymous
Not applicable
2017-01-13
04:51 PM
Author
- Mark as New
- Bookmark
- Subscribe
- Mute
- Subscribe to RSS Feed
- Permalink
- Report Inappropriate Content
That should be another thread, but it would be Chart Properties >Axes > Show Grid.
196 Views