Unlock a world of possibilities! Login now and discover the exclusive benefits awaiting you.
- Qlik Community
- :
- All Forums
- :
- QlikView App Dev
- :
- Re: YTD Sales analysis Calculation
- Subscribe to RSS Feed
- Mark Topic as New
- Mark Topic as Read
- Float this Topic for Current User
- Bookmark
- Subscribe
- Mute
- Printer Friendly Page
- Mark as New
- Bookmark
- Subscribe
- Mute
- Subscribe to RSS Feed
- Permalink
- Report Inappropriate Content
YTD Sales analysis Calculation
Hello,
I was trying to show the sales analysis for Fiscal year that shows from Apr to Mar. When I select Customer, Year and Month the sum of sales shows correctly. However If I select just Year, the sales amount shows way over.
The Expression formula that shows in text object looks like below :
=NUM(Sum({<Fyear={'$(vMaxYear)'},Date={'<=$(vMaxDate)'},Month=,Day=,FMonth=>}(History_Shipments * Price_Price)),'$ #,##0', '.',',')
=NUM(sum({<Year={'$(vMaxYear)'},Month={'$(vMaxMonth)'},Day={'<=$(vMaxDay)'},Date=,FMonth=>}(History_Shipments * Price_Price)),'$ #,##0', '.',',')
One thing to mention, this formulas gives me correct answers when I do it on straight table. This happens only on Text object as the requirement is to display on text object.
Can anybody please help?
Thnaks,
Wossen
- Mark as New
- Bookmark
- Subscribe
- Mute
- Subscribe to RSS Feed
- Permalink
- Report Inappropriate Content
Based on a particular selection what number do you expect to see?
- Mark as New
- Bookmark
- Subscribe
- Mute
- Subscribe to RSS Feed
- Permalink
- Report Inappropriate Content
May be try this:
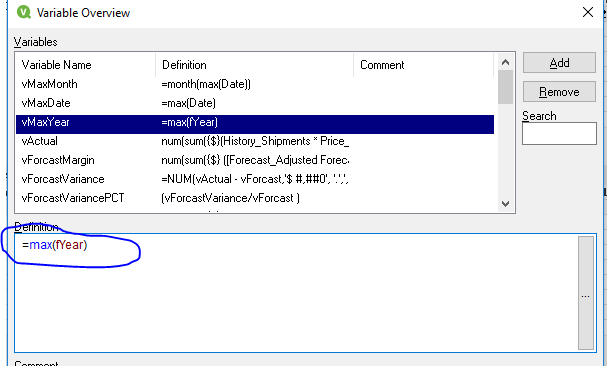
=NUM(Sum({<fYear={$(vMaxYear)},Date={'<=$(=vMaxDate)'},Month=,Day=,FMonth=>}(History_Shipments * Price_Price)),'$ #,##0', '.',',')
and vMaxYear = Max(fYear)
- Mark as New
- Bookmark
- Subscribe
- Mute
- Subscribe to RSS Feed
- Permalink
- Report Inappropriate Content
When I select for the Year
| Apr | May | Jun | Jul | Aug | Sep | Oct | Nov | Dec | Jan | Feb | Mar |
| 9,065,733 | 8,390,574 | 8,491,644 | 10,215,084 | 10,089,818 | 13,441,768 | 12,539,099 | 9,058,602 | 16,600,060 | 10,268,091 | 13,639,510 | 13,720,081 |
Sorry I copy and past it the test file and looks ugly.
But the total YTD for year 2014-2015 from April to March equal to 135,520,065
And for the Actual value for Max(month) - Mar-15 is 13,720,081
- Mark as New
- Bookmark
- Subscribe
- Mute
- Subscribe to RSS Feed
- Permalink
- Report Inappropriate Content
May be this:
=Num(Sum({<fYear={$(vMaxYear)},Date={'<=$(=vMaxDate)'},Month=,Day=,FMonth=,[Customer Name] *={"*"}>}(History_Shipments * Price_Price)),'$ #,##0', '.',',')
- Mark as New
- Bookmark
- Subscribe
- Mute
- Subscribe to RSS Feed
- Permalink
- Report Inappropriate Content
Sunny - Thanks for your help. Whenever I selected the customer names the total YTD result look right, but if I do select just for the years it give me more than what I anticipated.
I will try to generate another test file and validate the data against QV.
The other question I have, I know you were trying to help me on the other thread about displaying the result in the Text object. Since you have the idea now let me explain it. I have three text objects, one for Actual which is for MTD, then another one for Forecast text object. The third one is for Actual/Forecast, which should display the addition of MTD actual and Forecast. It seems easy but the Forecast/Actual box doesn't look quite right whenever I make different selection of year.
Forecast = Sum(Forecast Adjusted History * Price_Price) for selected Periods.
- Mark as New
- Bookmark
- Subscribe
- Mute
- Subscribe to RSS Feed
- Permalink
- Report Inappropriate Content
Did you try using this:
=Num(Sum({<fYear={$(vMaxYear)},Date={'<=$(=vMaxDate)'},Month=,Day=,FMonth=,[Customer Name] *={"*"}>}(History_Shipments * Price_Price)),'$ #,##0', '.',',')
I saw you had the Customer Name modifier in your set analysis for another expression. You seem to be ignoring Customer Name which are null. May be you would want to do that same here?
Let's just see if this resolve your current issue and then may be we can go back to the Actual/Forecast issue?
- Mark as New
- Bookmark
- Subscribe
- Mute
- Subscribe to RSS Feed
- Permalink
- Report Inappropriate Content
If you try with the above expression just for the year 2014, it gives you 23,835,683. The months for 2014 which is (2013/2014) based on the data are Jan-14, Feb14, and Mar-14 and the amounts are 120,702, 113,578, and 159,326 respectively and YTD total (3/31/2014) should be 393,605 . So there is a big differences.
- Mark as New
- Bookmark
- Subscribe
- Mute
- Subscribe to RSS Feed
- Permalink
- Report Inappropriate Content
I am trying to understand how you are getting 120,702 for Jan-14. What formula would you use to get that number???
History_Shipment * Price_Price
where Customer_Name is not null for fYear = 2014 and FMonth = Jan
Or is there another expression you are using????
- Mark as New
- Bookmark
- Subscribe
- Mute
- Subscribe to RSS Feed
- Permalink
- Report Inappropriate Content
I am getting a 7,180,540 for Jan-14. If you can share how you get 120,702, we might be able to figure this out
- Mark as New
- Bookmark
- Subscribe
- Mute
- Subscribe to RSS Feed
- Permalink
- Report Inappropriate Content
The amount for 120,702 is from the pivot table which I do the validation against QV.. I did extract from the database and export it to excel so that I can able to do pivot table , uncheck all the null and can able to see the aggregate result by year by month based on customers, Molecule, strength and Description.
That is the expression I was using History_Shipment * Price_Price.
The weirdest thing is when I select couple of customers the result looks fine. But just for the whole customer without any selection just for the year it is way off!
Getting confused 