Unlock a world of possibilities! Login now and discover the exclusive benefits awaiting you.
- Qlik Community
- :
- All Forums
- :
- QlikView App Dev
- :
- Re: YTD Sales analysis Calculation
- Subscribe to RSS Feed
- Mark Topic as New
- Mark Topic as Read
- Float this Topic for Current User
- Bookmark
- Subscribe
- Mute
- Printer Friendly Page
- Mark as New
- Bookmark
- Subscribe
- Mute
- Subscribe to RSS Feed
- Permalink
- Report Inappropriate Content
YTD Sales analysis Calculation
Hello,
I was trying to show the sales analysis for Fiscal year that shows from Apr to Mar. When I select Customer, Year and Month the sum of sales shows correctly. However If I select just Year, the sales amount shows way over.
The Expression formula that shows in text object looks like below :
=NUM(Sum({<Fyear={'$(vMaxYear)'},Date={'<=$(vMaxDate)'},Month=,Day=,FMonth=>}(History_Shipments * Price_Price)),'$ #,##0', '.',',')
=NUM(sum({<Year={'$(vMaxYear)'},Month={'$(vMaxMonth)'},Day={'<=$(vMaxDay)'},Date=,FMonth=>}(History_Shipments * Price_Price)),'$ #,##0', '.',',')
One thing to mention, this formulas gives me correct answers when I do it on straight table. This happens only on Text object as the requirement is to display on text object.
Can anybody please help?
Thnaks,
Wossen
- Mark as New
- Bookmark
- Subscribe
- Mute
- Subscribe to RSS Feed
- Permalink
- Report Inappropriate Content
What customer selection gives you the correct output? I randomly selected 4 customers here and for Jan-14, I get a total of over 120,702
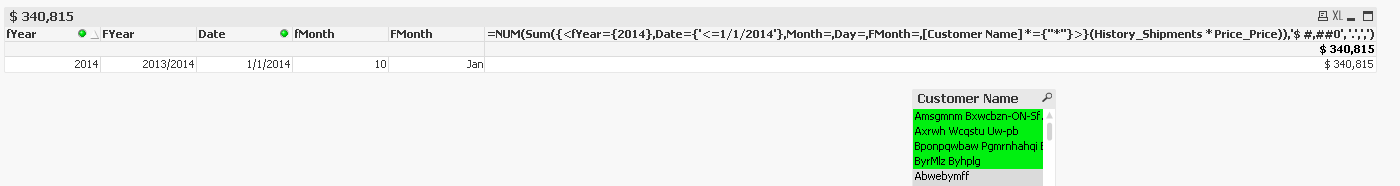
You would expect this number to be much below that, right? If all customers combined give 120,702, 4 customers should be a number lower than 120,702? When you select 2-3 customers you see a number smaller than 120,702?
- Mark as New
- Bookmark
- Subscribe
- Mute
- Subscribe to RSS Feed
- Permalink
- Report Inappropriate Content
Sunny - It is hard to tell the name of the customer for the one which I posted it here. For security reason I did scrambled it and hard to tell which one to select.
The only problem I have is when I don't select the Customer name, just the Year. The YTD should be add all the customer for selected year. That is higher than I expected.
I really appreciate for your help Sunny! I guess I need to re-extract the data from DB and generate the test file again
- Mark as New
- Bookmark
- Subscribe
- Mute
- Subscribe to RSS Feed
- Permalink
- Report Inappropriate Content
I understand what you are saying, but what I am trying to do is to go down to the most granular level possible to figure out the issue. There is def. something I am missing, because most customer I select in the attached application alone give me a Historical_Shipments * Price_Price of over 120k. So I am not sure how well the sum of all customers will give me more 120k? Do you have any other filters when you extract the data from your db? May be we need to add a filter in the set analysis to get there?
- Mark as New
- Bookmark
- Subscribe
- Mute
- Subscribe to RSS Feed
- Permalink
- Report Inappropriate Content
You know what Sunny - I just did re-run the extract just for year 2014 with clean data that has no blank or null values, and now the data matches what it shows on qv.The one I was working was from couple days ago!! Phewwwwwwww! Sorry about that Sunny! 
Now we are back to business. Any ideas about the Text objects that we plan to do next?
- Mark as New
- Bookmark
- Subscribe
- Mute
- Subscribe to RSS Feed
- Permalink
- Report Inappropriate Content
Can you re-explain what exactly we are looking to do? Actual/Forecast? I am seeing Forecast to be 0 in the attached application
- Mark as New
- Bookmark
- Subscribe
- Mute
- Subscribe to RSS Feed
- Permalink
- Report Inappropriate Content
Yes - if you click for year 2017, you will see the value. So the requirement is to display on the Actual/Forecast text object the sum of the following:
Sum(History_Shipment * Price_Price) for selected period + Sum (Forecast_Adjusted_Forecast * Price) for selected periods.
so Actual = Sum(History_Shipment * Price_Price)
Forecaste = Sum (Forecast_Adjusted_Forecast * Price)
- Mark as New
- Bookmark
- Subscribe
- Mute
- Subscribe to RSS Feed
- Permalink
- Report Inappropriate Content
May be this?
=Num(RangeSum(Sum({<fYear={$(vMaxYear)},Date={'<=$(=vMaxDate)'},Month=,Day=,FMonth=,[Customer Name] *={"*"}>}(History_Shipments * Price_Price)), $(vForecast)),'$ #,##0', '.',',')
- Mark as New
- Bookmark
- Subscribe
- Mute
- Subscribe to RSS Feed
- Permalink
- Report Inappropriate Content
You are the BEST Sunny!
Thanks for your time and BIG help!
- Mark as New
- Bookmark
- Subscribe
- Mute
- Subscribe to RSS Feed
- Permalink
- Report Inappropriate Content
Yup, no problem at all
- Mark as New
- Bookmark
- Subscribe
- Mute
- Subscribe to RSS Feed
- Permalink
- Report Inappropriate Content
One more thing
When I do line chart for Actual and forecast do I have to use the same expression that I used for the text object or
=Sum (History_Shipments * Price_Price) for actual and =Sum (History_adjusted History * Price_Price) for Forecast?