Unlock a world of possibilities! Login now and discover the exclusive benefits awaiting you.
- Qlik Community
- :
- All Forums
- :
- QlikView App Dev
- :
- YTD based on date selection for each month in the ...
- Subscribe to RSS Feed
- Mark Topic as New
- Mark Topic as Read
- Float this Topic for Current User
- Bookmark
- Subscribe
- Mute
- Printer Friendly Page
- Mark as New
- Bookmark
- Subscribe
- Mute
- Subscribe to RSS Feed
- Permalink
- Report Inappropriate Content
YTD based on date selection for each month in the year of selected date
Date MonthYr Value
30-Dec-2016 Dec-2016 100
1-Jan-2017 Jan-2017 10
3-Jan-2017 Jan-2017 11
1-Feb-2017 Feb-2017 20
10-Feb-2017 Feb-2017 30
1-Mar-2017 Mar-2017 60
The above is my data and i need,
If i select a date i.e. 1-Feb-2017, the result should show value from year start to end of the month of selected date.
result should be like below,
MonthYr Sum(Value)
Jan-2017 21
Feb-2017 50
and if i select a date i.e 30-Dec-2016 the result will be,
MonthYr Sum(Value)
Dec-2016 100
- Tags:
- ytd month wise
- « Previous Replies
-
- 1
- 2
- Next Replies »
Accepted Solutions
- Mark as New
- Bookmark
- Subscribe
- Mute
- Subscribe to RSS Feed
- Permalink
- Report Inappropriate Content
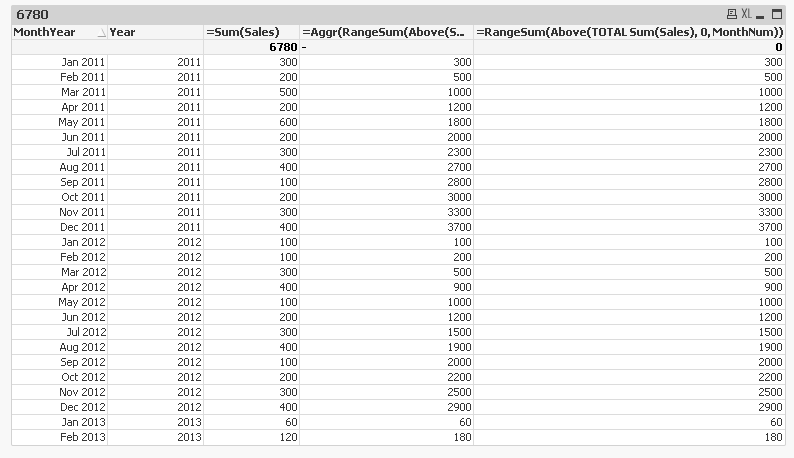
Two ways to do this
1) Use this expression (this will assume that your data is sorted by MonthYear in ascending order in the script)
=Aggr(RangeSum(Above(Sum(Sales), 0, RowNo())), Year, MonthYear)
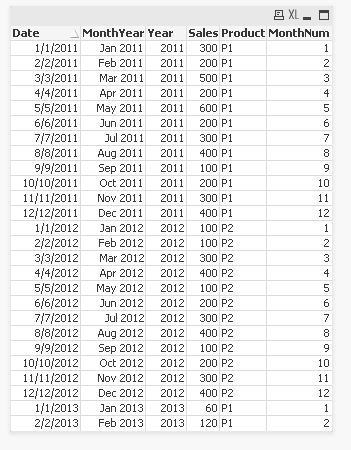
2) Create another field called MonthNum in the script
LOAD Year as Date,
MonthName(Year) as MonthYear,
Year(Year) as Year,
Sales,
Product,
Num(Month(Year)) as MonthNum
FROM
[Month on Month.xls]
(biff, embedded labels, table is Sheet1$);
Which will look like this:
and then use this expression:
=RangeSum(Above(TOTAL Sum(Sales), 0, MonthNum))
- Mark as New
- Bookmark
- Subscribe
- Mute
- Subscribe to RSS Feed
- Permalink
- Report Inappropriate Content
May be this:
Sum({<Date = {"$(='>=' & Date(YearStart(Max(Date)), 'D-MMM-YYYY') & '<=' & Date(Max(Date), 'D-MMM-YYYY'))"}, MonthYr>} Value)
- Mark as New
- Bookmark
- Subscribe
- Mute
- Subscribe to RSS Feed
- Permalink
- Report Inappropriate Content
Just make sure that QlikView read your date as a dual field and not a text. Look here for help on these topic
- Mark as New
- Bookmark
- Subscribe
- Mute
- Subscribe to RSS Feed
- Permalink
- Report Inappropriate Content
Hi sunny,
Thanks for your reply. it is working for maximum month(selected date) only, it doesn't work for other month.
- Mark as New
- Bookmark
- Subscribe
- Mute
- Subscribe to RSS Feed
- Permalink
- Report Inappropriate Content
Where are you making selection MonthYr field or do you have another field? Please share a sample where this isn't working for you 
- Mark as New
- Bookmark
- Subscribe
- Mute
- Subscribe to RSS Feed
- Permalink
- Report Inappropriate Content
Hi Sunny,
Im selecting date field. not MonthYr
- Mark as New
- Bookmark
- Subscribe
- Mute
- Subscribe to RSS Feed
- Permalink
- Report Inappropriate Content
Hi Sunny,
My Selection is date field.Here i attached the sample file.
I need output like this
| MonthYear | Year | Sales | Output | Explanation | |
| Jan 2011 | 2011 | 300 | 300 | 300 | |
| Feb 2011 | 2011 | 200 | 500 | 300+200=500 | |
| Mar 2011 | 2011 | 500 | 1000 | 500+500=1000 | |
| Apr 2011 | 2011 | 200 | 1200 | 1000+200=1200 | |
| May 2011 | 2011 | 600 | 1800 | ||
| Jun 2011 | 2011 | 200 | 2000 | ||
| Jul 2011 | 2011 | 300 | 2300 | ||
| Aug 2011 | 2011 | 400 | 2700 | ||
| Sep 2011 | 2011 | 100 | 2800 | ||
| Oct 2011 | 2011 | 200 | 3000 | ||
| Nov 2011 | 2011 | 300 | 3300 | ||
| Dec 2011 | 2011 | 400 | 3700 | ||
| Jan 2012 | 2012 | 100 | 100 | Reset point | Year start so no need to add previous month value |
| Feb 2012 | 2012 | 100 | 200 | ||
| Mar 2012 | 2012 | 300 | 500 | ||
| Apr 2012 | 2012 | 400 | 900 | ||
| May 2012 | 2012 | 100 | 1000 | ||
| Jun 2012 | 2012 | 200 | 1200 | ||
| Jul 2012 | 2012 | 300 | 1500 | ||
| Aug 2012 | 2012 | 400 | 1900 | ||
| Sep 2012 | 2012 | 100 | 2000 | ||
| Oct 2012 | 2012 | 200 | 2200 | ||
| Nov 2012 | 2012 | 300 | 2500 | ||
| Dec 2012 | 2012 | 400 | 2900 | ||
| Jan 2013 | 2013 | 60 | 60 | Reset point | |
| Feb 2013 | 2013 | 120 | 180 |
- Mark as New
- Bookmark
- Subscribe
- Mute
- Subscribe to RSS Feed
- Permalink
- Report Inappropriate Content
Two ways to do this
1) Use this expression (this will assume that your data is sorted by MonthYear in ascending order in the script)
=Aggr(RangeSum(Above(Sum(Sales), 0, RowNo())), Year, MonthYear)
2) Create another field called MonthNum in the script
LOAD Year as Date,
MonthName(Year) as MonthYear,
Year(Year) as Year,
Sales,
Product,
Num(Month(Year)) as MonthNum
FROM
[Month on Month.xls]
(biff, embedded labels, table is Sheet1$);
Which will look like this:
and then use this expression:
=RangeSum(Above(TOTAL Sum(Sales), 0, MonthNum))
- Mark as New
- Bookmark
- Subscribe
- Mute
- Subscribe to RSS Feed
- Permalink
- Report Inappropriate Content
Updated the expressions to make sure they work even when you make selections
1) =Aggr(RangeSum(Above(Sum({<Date, MonthYear, Year>}Sales), 0, RowNo())), Year, MonthYear)
2) =RangeSum(Above(TOTAL Sum({<Date, MonthYear, Year>}Sales), 0, MonthNum)) * Avg(1)
- Mark as New
- Bookmark
- Subscribe
- Mute
- Subscribe to RSS Feed
- Permalink
- Report Inappropriate Content
Hi Sunny,
Thank you very much. it working now.
but if i do the same thing in pivot table how to use
this sunny.
RangeSum(Above(Sum(Sales), 0, MonthNum))
this exp is not working on pivot table.
- « Previous Replies
-
- 1
- 2
- Next Replies »