Unlock a world of possibilities! Login now and discover the exclusive benefits awaiting you.
- Qlik Community
- :
- All Forums
- :
- QlikView App Dev
- :
- YTD calculation in Pivot table
- Subscribe to RSS Feed
- Mark Topic as New
- Mark Topic as Read
- Float this Topic for Current User
- Bookmark
- Subscribe
- Mute
- Printer Friendly Page
- Mark as New
- Bookmark
- Subscribe
- Mute
- Subscribe to RSS Feed
- Permalink
- Report Inappropriate Content
YTD calculation in Pivot table
Hi All,
I want to create a pivot table whose dimension will be year and i want to calculate the YTD for the revenue field "rev_total". The YTD calculation is for the Fiscal year starting from November of every year.Currently i am trying to use set analysis in the expression of the revenue field but its not working. Please help me in resolving this issue. The inline table and the set analysis equation is as given below
sum({<Date={">=$(=date(yearstart(makedate(year,11,01),0,11),'DD/MM/YYYY'))"}>}rev_total)
load * inline
[tran_date,transid,rev_total
12/08/2016,76354,567
12/09/2016,76355,56
12/10/2016,76356,5676
12/11/2016,76357,55
13/12/2016,76358,123
14/12/2016,76359,124
16/05/2017,76345,125
12/06/2017,76361,5126
12/07/2017,76362,126
12/08/2017,76363,127
12/09/2017,76364,128
12/10/2017,76365,129
12/11/2017,76366,130
13/11/2017,76367,131
14/11/2017,76368,132
18/11/2017,76369,133
02/12/2017,76370,134
08/12/2017,76371,135
16/12/2017,76372,136
];
Thanks in Advance.
regards,
Sonthu
- Mark as New
- Bookmark
- Subscribe
- Mute
- Subscribe to RSS Feed
- Permalink
- Report Inappropriate Content
May be this? Fiscal Year
Sum({<tran_date = {">=$(=Date(MonthStart(AddMonths(Today(),-1)),'DD/MM/YYYY')) <=$(=Max(tran_date))"}>} rev_total)
- Mark as New
- Bookmark
- Subscribe
- Mute
- Subscribe to RSS Feed
- Permalink
- Report Inappropriate Content
Try this
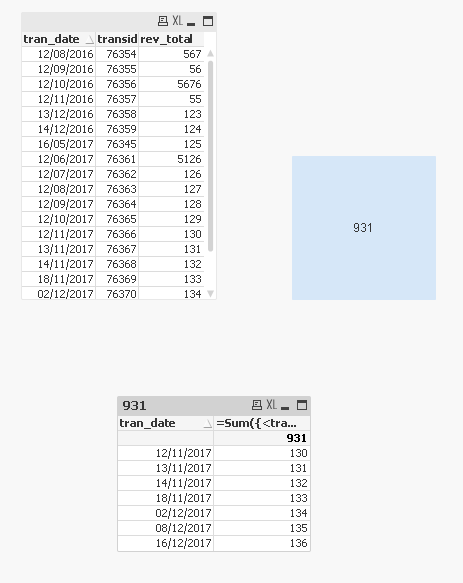
=Sum({<tran_date={">=$(=Date(YearStart(Today(),0,11), 'DD/MM/YYYY'))"}>} rev_total)
- Mark as New
- Bookmark
- Subscribe
- Mute
- Subscribe to RSS Feed
- Permalink
- Report Inappropriate Content
Hi Sunny,
Thank you so much for your reply. What you have calculated is correct for the year 2017, but what about the YTD calculation for 2016. How can we calculate that. i want the pivot chart to show the calculation as below
| Year | Total revenue |
|---|---|
| 2016 | 302 |
| 2017 | 931 |
Regards,
Sonthu
- Mark as New
- Bookmark
- Subscribe
- Mute
- Subscribe to RSS Feed
- Permalink
- Report Inappropriate Content
Try this
=Sum({<tran_date={"=SetDateYear(tran_date, Year(Today())) >= YearStart(Today(), 0, 11) and SetDateYear(tran_date, Year(Today())) <= Today()"}>} rev_total)
