Unlock a world of possibilities! Login now and discover the exclusive benefits awaiting you.
- Qlik Community
- :
- All Forums
- :
- QlikView App Dev
- :
- YTD calculations
- Subscribe to RSS Feed
- Mark Topic as New
- Mark Topic as Read
- Float this Topic for Current User
- Bookmark
- Subscribe
- Mute
- Printer Friendly Page
- Mark as New
- Bookmark
- Subscribe
- Mute
- Subscribe to RSS Feed
- Permalink
- Report Inappropriate Content
YTD calculations
Hi All I am expecting a chart like below.
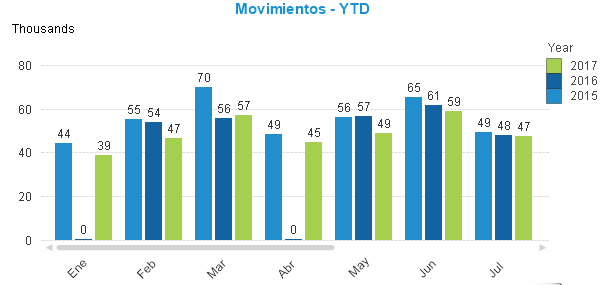
Dimension: Year
Expression: Count(GrossSales_Policy)
Now I want to create a YTD chart. Here YTD means the maximumum date in the maximum year.
so max year is 2017
max date is 27
max month is sep
in the chart i should see data for
1-jan-2016 to 27-Sep-2016
1-jan-2015 to 27-Sep-2015
Individually I have calculated them using below expressions. I want to have a expression to accomodate any number of year's data. so I need not add expression for each year.
if 2016 is selected then for CY=2016
PY=2015
PY_1=2014
eYTDMovementsCY
Count({<Year={'$(=Max(Year))'},Date3={"<=$(=$(vSelectYrDate))"},Month=>}GrossSales_Policy)
eYTDMovementsPY
Count({<Year={'$(=Max(Year)-1)'},Date3={"<=$(=$(vPrevYrDate))"},Month=>}GrossSales_Policy)
vMaxYear Year(Max(Date3))
vMaxPrYear Year(Max(Date3))-1
vAllMaxMonth Num(Month(Max( ALL Date3)))
vAllMaxDate Date(Max(ALL Date3), 'DD-MMM-YY')
vAllMaxDay Day(Max(ALL Date3))
vSelectYrDate Date(MakeDate($(vMaxYear),$(vAllMaxMonth),$(vAllMaxDay)), 'DD-MMM-YY')
vPrevYrDate Date(MakeDate($(vMaxPrYear),$(vAllMaxMonth),$(vAllMaxDay)), 'DD-MMM-YY')
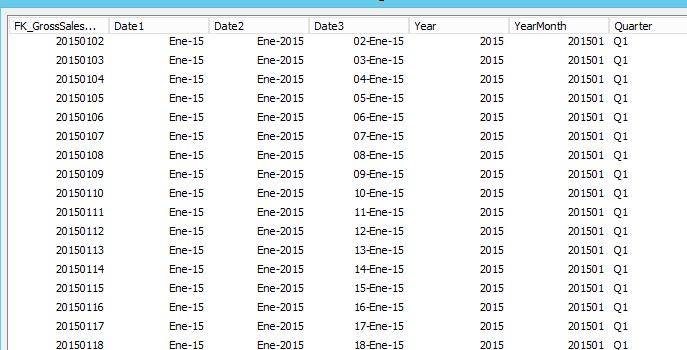
master calendar used;
- Tags:
- set expression
- « Previous Replies
- Next Replies »
Accepted Solutions
- Mark as New
- Bookmark
- Subscribe
- Mute
- Subscribe to RSS Feed
- Permalink
- Report Inappropriate Content
Use this if you have QV12 or above
Aggr(RangeSum(Above(Sum({<[Trade Date] = {"=SetDateYear([Trade Date], Max(TOTAL Year)) <= Max(TOTAL [Trade Date])"}>} [Trade Revenue])/100000000, 0, RowNo())), Year, (Month,(NUMERIC)))
- Mark as New
- Bookmark
- Subscribe
- Mute
- Subscribe to RSS Feed
- Permalink
- Report Inappropriate Content
You can use YearStart() in set analysis
- Mark as New
- Bookmark
- Subscribe
- Mute
- Subscribe to RSS Feed
- Permalink
- Report Inappropriate Content
No I don't understand. Can you please elaborate?
- Mark as New
- Bookmark
- Subscribe
- Mute
- Subscribe to RSS Feed
- Permalink
- Report Inappropriate Content
This is my intention
Count({<Year={'$(=Max(Year))'},Date3={">=$(=Date(YearStart(Max($(vSelectYrDate))))) <=$(=$(vSelectYrDate))"},Month=>}GrossSales_Policy)
- Mark as New
- Bookmark
- Subscribe
- Mute
- Subscribe to RSS Feed
- Permalink
- Report Inappropriate Content
The Idea is right now I have
Dimension: Year
Expression: Count(Policy)
For YTD chart I need same as above a single expression chart
Dimension: Year
Expression: Count({Set expression} Policy)
Entire data set Max date 27-Sep
the set expression should restrict data from starting of any year till 27-Sep of that year
- Mark as New
- Bookmark
- Subscribe
- Mute
- Subscribe to RSS Feed
- Permalink
- Report Inappropriate Content
For YTD chart I need same as above a single expression chart
Dimension: Year
Expression: Count({Set expression} Policy)
Entire data set Max date 27-Sep
the set expression should restrict data from starting of any year till 27-Sep of that year
Yes, This is my answer
Count({<DateField = {">=$(=Date(YearStart(Max(DateField)))) <=$(=Max(DateField))"}>} Policy)
- Mark as New
- Bookmark
- Subscribe
- Mute
- Subscribe to RSS Feed
- Permalink
- Report Inappropriate Content
Just tell me something
what should be the format for Date Field in your expression?
- Mark as New
- Bookmark
- Subscribe
- Mute
- Subscribe to RSS Feed
- Permalink
- Report Inappropriate Content
Try from your end. My format is DD-MM-YYYY
Count({<DateField = {">=$(=Date(Date#(YearStart(Max(DateField)),'YourFormat'),'DateFieldFormat')) <=$(=Max(DateField))"}>} Policy)
- Mark as New
- Bookmark
- Subscribe
- Mute
- Subscribe to RSS Feed
- Permalink
- Report Inappropriate Content
stalwar1 loveisfail kush141087
Need your help.
Hi In attached App we have sheets A and B
Both Sheets have Monthly and YTD charts.
In sheet A YTD chart I have used 3 expression to achieve my need which is For each year the data should be between start of that year to Max date determined.
I want this to be done in a single expression so that as the number of years increase I dont have to write a separate expression for each year.
I need a set expression similar to this
max data in entire data model. 2-Jun
Dim: Year and Month
Exp:Sum({for all data between start of the year and 2-Jun of that year}Revenue)
In YTD the values for each month should be accumulative.
Actual:
2011
Jan-10
Feb-20
Mar-30
YTD:
2011
Jan-10
Feb-30(10+20)
Mar-40((10+20+30)
- Mark as New
- Bookmark
- Subscribe
- Mute
- Subscribe to RSS Feed
- Permalink
- Report Inappropriate Content
May be try this
Sum({<[Trade Date] = {"=SetDateYear([Trade Date], Max(TOTAL Year)) <= Max(TOTAL [Trade Date])"}>} [Trade Revenue])
- « Previous Replies
- Next Replies »