Unlock a world of possibilities! Login now and discover the exclusive benefits awaiting you.
- Qlik Community
- :
- All Forums
- :
- QlikView App Dev
- :
- Re: calculating confidence intervals
- Subscribe to RSS Feed
- Mark Topic as New
- Mark Topic as Read
- Float this Topic for Current User
- Bookmark
- Subscribe
- Mute
- Printer Friendly Page
- Mark as New
- Bookmark
- Subscribe
- Mute
- Subscribe to RSS Feed
- Permalink
- Report Inappropriate Content
calculating confidence intervals
Hi ,
I would like to generate confidence intervals for a dataset... lets use student grades as the metric (range from 1-100%).
There are QV several functions that resemble the word "confidence" intervals... lower confidence interval, upper confidence interval, however, I'm not clear what the differences are for the similar functions. So I picked: TTest1_lower(Grade_N) , There are several others, i.e. ttest_conf( Group, Value ) , ttest_lower( Group, Value ), etc.
The end result is a line chart with upper and control limits overlayed. My intent was to create the two limits: "UCL" and "LCL" via the "Reference Lines" of the Chart Properties. However, this is not working.
Please assist 🙂
Stephanie
- Tags:
- confidence_limits
- Mark as New
- Bookmark
- Subscribe
- Mute
- Subscribe to RSS Feed
- Permalink
- Report Inappropriate Content
I don't know if this is what you are looking for - but this is the equation that we got to work:
=
0.05 + 1.96*(stdev(Range)/sqrt(PopulationSize)))
This works for 95% confidence
Hope it helps
- Mark as New
- Bookmark
- Subscribe
- Mute
- Subscribe to RSS Feed
- Permalink
- Report Inappropriate Content
Hi there,
so sorry for the late reply. I am just now revisiting the statistics application that I've been working with. What is your "mean"... is it .05...is .05 the average Range? then you add and subtract 1.96*stdev(Range)/sqrt(PopulationSize) to the "mean".... I am just restating your formula to make sure I have it right?
I hope you still remember this topic?
- Mark as New
- Bookmark
- Subscribe
- Mute
- Subscribe to RSS Feed
- Permalink
- Report Inappropriate Content
Hi there,
As far as I can remember the range will be the measure, ie amount of grades and the population will be the amount of students. This will give you an absolute value. We then worked out the % interval using a formula like this:
=(0.05 + 1.96*(stdev(Range)/sqrt(count(PopulationSize)))) / Avg(Range) which gave me a average confidence in %.
I am not quite sure how the upper and lower will work in this function as we only had to get to one answer.
If I remember correctly the 0.05 is the variable for the 95%
- Mark as New
- Bookmark
- Subscribe
- Mute
- Subscribe to RSS Feed
- Permalink
- Report Inappropriate Content
HI ,
I am also trying to put a 95% confidence Band on the Linear regression line .. can you Share a QVW or something to accomplish this
Thanks,
Sai
- Mark as New
- Bookmark
- Subscribe
- Mute
- Subscribe to RSS Feed
- Permalink
- Report Inappropriate Content
Concerning confidence interval of a linear regression :
this depends also on hat value of each point and on t value given by ttest function :
Confidence Interval upper bond =
$(a) * $(x) + $(b) +
sqrt(sum(total aggr(pow($(y) - ($(a) * $(x) + $(b)),2) , $(id))) /n) * sqrt(n/(n-2))
* t * sqrt(pow(($(x) - avg(total $(x))),2)/pow(stdev(total $(x)),2)/(n-1) + 1/n)
with y = a*x + b your linear regression
residual value = $(y) - ($(a) * $(x) + $(b))
t = ttest value for desired confidence
n = sample size
id = identifying field
where :
sqrt(sum(total aggr(pow($(y) - ($(a) * $(x) + $(b)),2) , $(id))) /n) * sqrt(n/(n-2))
= corrected standard dev of residual
sqrt(pow(($(x) - avg(total $(x))),2)/pow(stdev(total $(x)),2)/(n-1) + 1/n)
= hat value at point x
and :
a= correl($(x),$(y))*stdev($(y))/stdev($(x))
b= avg($(y)) - $(a)*avg($(x))
or use LINEST_ functions
Same for prediction interval (add noise = stdev residual)
Prediction Interval upper bond :
$(a) * $(x) + $(b) +
sqrt(sum(total aggr(pow($(y) - ($(a) * $(x) + $(b)),2) , $(id))) /n) * sqrt(n/(n-2))
* t * sqrt(pow(($(x) - avg(total $(x))),2)/pow(stdev(total $(x)),2)/(n-1) + 1/n + 1)
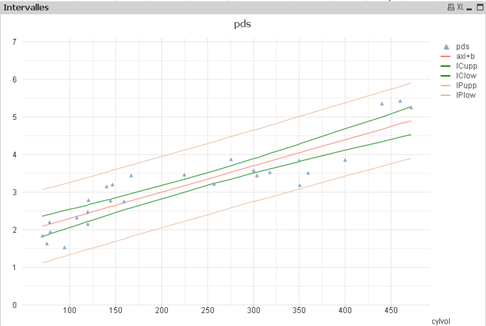
verified with R
predict(model,interval = "confidence") or "prediction"
regards,
- Mark as New
- Bookmark
- Subscribe
- Mute
- Subscribe to RSS Feed
- Permalink
- Report Inappropriate Content
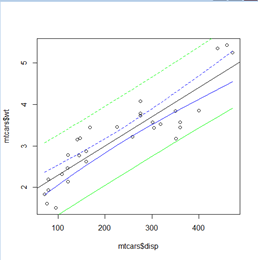
Hi Olivier
This is really interesting. Would you mind sharing the qlikview application with this example?
Thank you
Lorenzo
- Mark as New
- Bookmark
- Subscribe
- Mute
- Subscribe to RSS Feed
- Permalink
- Report Inappropriate Content
Hi Lorenzo,
unfortunately I've free desktop version,
but I'm happy you find this interesting,
all expressions used are above
x :name of the field x
y : name of field or an expression
a and b of linear regression are given as a formula
and prediction or confidence interval are based upon standard formula
if you have your own sample, send/attach to make together what is interesting you :
hat values, cook's distance and other residual analysis factors can be calculated within Qlik without calling R.
regards
- Mark as New
- Bookmark
- Subscribe
- Mute
- Subscribe to RSS Feed
- Permalink
- Report Inappropriate Content
Hi Olivier
What I'm most interested in is to see how you've developed it into a qlikview application. I have a license so, if you send me your file (even if you have the free version), I will be able to open it
I've been using qlikview for a few years but I've struggled to find many examples of how statistical analysis can be integrated (without calling R)
Lorenzo