Unlock a world of possibilities! Login now and discover the exclusive benefits awaiting you.
- Qlik Community
- :
- All Forums
- :
- QlikView App Dev
- :
- create dates and display change over time
- Subscribe to RSS Feed
- Mark Topic as New
- Mark Topic as Read
- Float this Topic for Current User
- Bookmark
- Subscribe
- Mute
- Printer Friendly Page
- Mark as New
- Bookmark
- Subscribe
- Mute
- Subscribe to RSS Feed
- Permalink
- Report Inappropriate Content
create dates and display change over time
HI.
I have dates for when a value changes. But i want to have all dates so that i can, over time, see how the value has changed.
So i autogenerated the dates and kept the dates on an island in my datamodel no i'm thinking i did it worng.
What i'm trying to create is date on the x-axes and value on the y-axes and the line charts for the sort of which the values has changed.
Please help.
Thanks in advance!
//A.
- « Previous Replies
-
- 1
- 2
- Next Replies »
Accepted Solutions
- Mark as New
- Bookmark
- Subscribe
- Mute
- Subscribe to RSS Feed
- Permalink
- Report Inappropriate Content
I think you just need to uncheck "Suppress zero values" and check "Show all values":
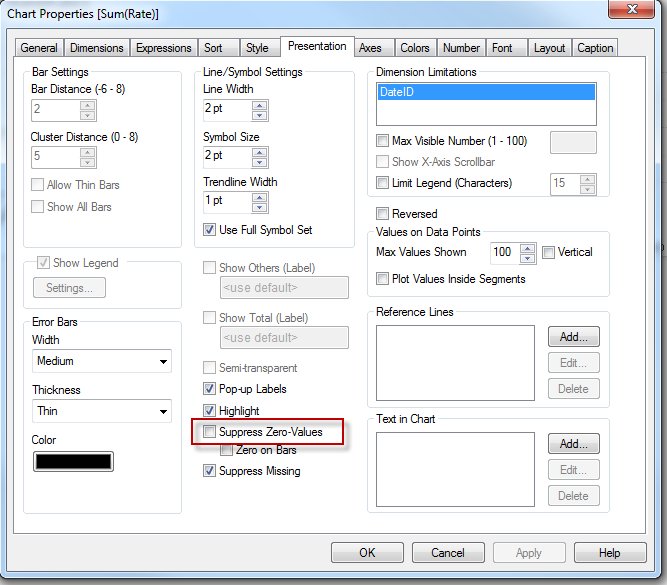
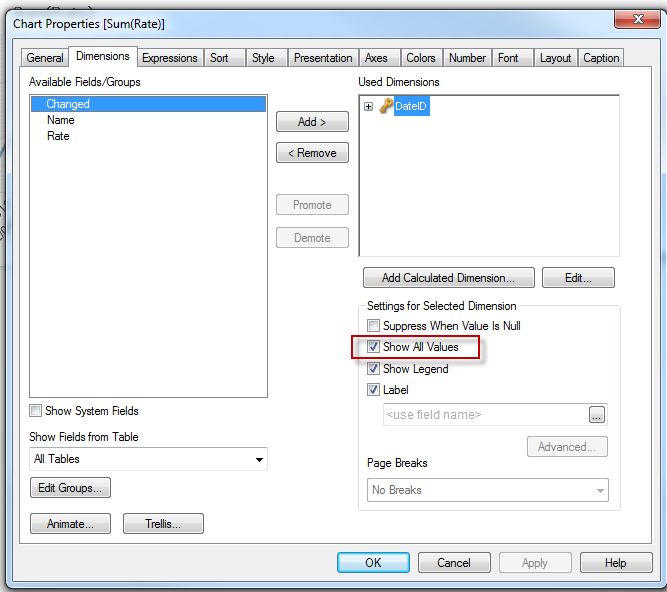
See this attachment - hope it helps.
Jason
- Mark as New
- Bookmark
- Subscribe
- Mute
- Subscribe to RSS Feed
- Permalink
- Report Inappropriate Content
You've autogenerated the dates, which is correct, but don't have them as a data island. Allow the two date fields to link and that should give you what you need. You might need to fiddle about with the chart settings to not suppress missing values.
Hope this helps,
Jason
- Mark as New
- Bookmark
- Subscribe
- Mute
- Subscribe to RSS Feed
- Permalink
- Report Inappropriate Content
I've tried that to but the x-axis still only shows the changedates. not the continues dates. what i did to connect woth the island was to wirte another line for changedate and name it as "DateID" and DateID is the generated dates in the end of the script.
Is this wrong?
- Mark as New
- Bookmark
- Subscribe
- Mute
- Subscribe to RSS Feed
- Permalink
- Report Inappropriate Content
Yes, I think so. Can you post your app?
- Mark as New
- Bookmark
- Subscribe
- Mute
- Subscribe to RSS Feed
- Permalink
- Report Inappropriate Content
no i can't do that. data is classified.
can i "scramble" data somehow in order to send it?
- Mark as New
- Bookmark
- Subscribe
- Mute
- Subscribe to RSS Feed
- Permalink
- Report Inappropriate Content
here's a simplyfied script if it helpes you:
table:
LOAD name,
round(rate, 0.01) as rate,
left(changed, 10) as changed,
left(changed, 10) as DateID,
FROM source;
join (table)
LOAD
name as timename
FROM source);
tmp:
LOAD
min(changed) as MinDate,
max(changed) as MaxDate
RESIDENT table;
LET Start = floor(YearStart(peek('MinDate')));
LET End = floor(YearEnd(peek('MaxDate')));
Drop Table tmp;
LET NumOfDays = End - Start + 1;
Date_src:
LOAD
$(Start) + Rowno() -1 as DateID
AUTOGENERATE $(NumOfDays);
Calendar:
LOAD
DateID,
date(DateID) as Date,
day(DateID) as Day,
week(DateID) as Week,
month(DateID) as Month,
dual(month(DateID) & '-' & year(DateID), year(DateID) & num(month(DateID), '00')) as MonthYear,
year(DateID) as Year,
weekday(DateID) as Weekday,
'Q' & ceil(month(DateID)/3) as Quarter,
dual('Q' & ceil(month(DateID)/3) & '-' & year(DateID), year(DateID) & ceil(month(DateID)/3)) as QtrYear
RESIDENT Date_src;
Drop Table Date_src;
- Mark as New
- Bookmark
- Subscribe
- Mute
- Subscribe to RSS Feed
- Permalink
- Report Inappropriate Content
the problem occurs when i choos a "name" or a "timename". then the chaged dates are the onle one showing. but if i ahven't selected anything every dates shows. but i have to be able to choos "name" and "timename".
- Mark as New
- Bookmark
- Subscribe
- Mute
- Subscribe to RSS Feed
- Permalink
- Report Inappropriate Content
I think you just need to uncheck "Suppress zero values" and check "Show all values":
See this attachment - hope it helps.
Jason
- Mark as New
- Bookmark
- Subscribe
- Mute
- Subscribe to RSS Feed
- Permalink
- Report Inappropriate Content
No, did'nt work. aldready tried it =(
i can se in my listboxes woth dates that the are fewer as ssoon as i choose a name och timename. i will look at the attachement as soon as i can! behind a firewall taht doesn't allow it right now.
Thanks!
- Mark as New
- Bookmark
- Subscribe
- Mute
- Subscribe to RSS Feed
- Permalink
- Report Inappropriate Content
Ok. My mistake. Sorry. It did work, only to many dates =).
Thank you so much!
- « Previous Replies
-
- 1
- 2
- Next Replies »