Unlock a world of possibilities! Login now and discover the exclusive benefits awaiting you.
- Qlik Community
- :
- All Forums
- :
- QlikView App Dev
- :
- Re: create stack and group bars in a same graph
- Subscribe to RSS Feed
- Mark Topic as New
- Mark Topic as Read
- Float this Topic for Current User
- Bookmark
- Subscribe
- Mute
- Printer Friendly Page
- Mark as New
- Bookmark
- Subscribe
- Mute
- Subscribe to RSS Feed
- Permalink
- Report Inappropriate Content
create stack and group bars in a same graph
hi all
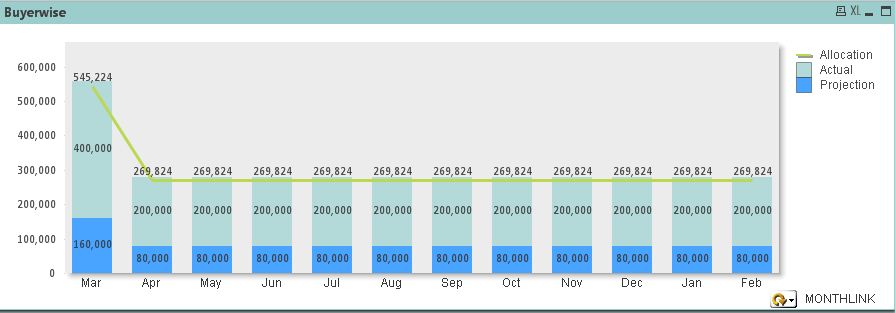
i would like create actual and projection in group ,whereas stack bar needs to be used for Allocation
- « Previous Replies
-
- 1
- 2
- Next Replies »
Accepted Solutions
- Mark as New
- Bookmark
- Subscribe
- Mute
- Subscribe to RSS Feed
- Permalink
- Report Inappropriate Content
- Mark as New
- Bookmark
- Subscribe
- Mute
- Subscribe to RSS Feed
- Permalink
- Report Inappropriate Content
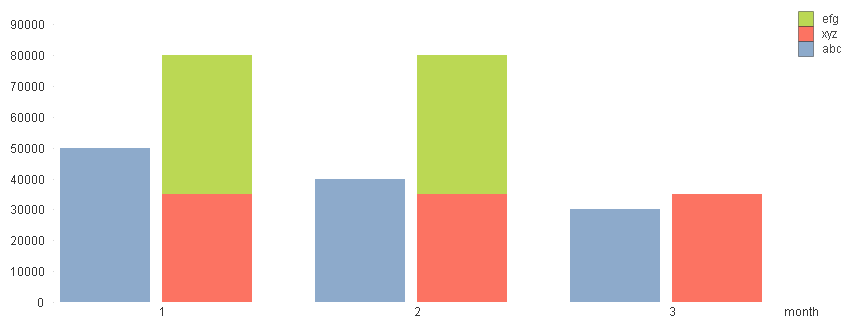
Yes, add two dimensions to your chart and select the option Stacked on the Style tab. You will get groups of stacked bars in your chart. If you want Allocation stacked then make it the second dimension in the chart.
talk is cheap, supply exceeds demand
- Mark as New
- Bookmark
- Subscribe
- Mute
- Subscribe to RSS Feed
- Permalink
- Report Inappropriate Content
Hi, by using below macro you can maintain both stacked an group style in single graph.
Sub ToggleChartBarStack
dim chart
dim cp
set chart = ActiveDocument.GetSheetObject("CH29")
set cp = chart.GetProperties
If cp.ChartProperties.BarModeStacked = true then
cp.ChartProperties.BarModeStacked = false
else
cp.ChartProperties.BarModeStacked = true
end if
chart.SetProperties cp
end sub
- Mark as New
- Bookmark
- Subscribe
- Mute
- Subscribe to RSS Feed
- Permalink
- Report Inappropriate Content
Hi Jayanthan,
Add 2 dimensions in a bar chart and 2 expressions and select Stacked style.
I have following data:
City,Population,Month
Mumbai,20,Jan
Pune,40,Jan
Mumbai,35,Feb
Goa,31,Jan
Mumbai,60,Mar
Pune,25,Feb
Pune,56,Apr
Goa,31,Feb
Goa,31,Apr
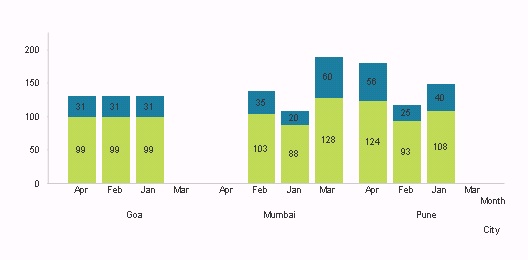
Add City and Month field in dimension and specify 2 expressions for the data. Here I have used following expressions:
=sum(Population+68)
=(sum(Population))
This gives following output where for City Goa we get Group of bars specifing Months and representing the values for both of the above expressions
- Mark as New
- Bookmark
- Subscribe
- Mute
- Subscribe to RSS Feed
- Permalink
- Report Inappropriate Content
Hi,
Look into attached file.
- Mark as New
- Bookmark
- Subscribe
- Mute
- Subscribe to RSS Feed
- Permalink
- Report Inappropriate Content
thank you all.
Sorry, i have miscommunicated earlier. I want Actual and Projection in Stack ,whereas allocation as another bar(since i do not how to have stack and group in a same chart, i have put allocation in line chart). {
Please refer the below screen shot
- Mark as New
- Bookmark
- Subscribe
- Mute
- Subscribe to RSS Feed
- Permalink
- Report Inappropriate Content
hi satya
it doesnt work for me. Kindly help to solve this issue
please refer the attached QVW
- Mark as New
- Bookmark
- Subscribe
- Mute
- Subscribe to RSS Feed
- Permalink
- Report Inappropriate Content
See attachment
- Mark as New
- Bookmark
- Subscribe
- Mute
- Subscribe to RSS Feed
- Permalink
- Report Inappropriate Content
superb Satya
thank you .
Can i know where i went wrong
Jayanthan
- Mark as New
- Bookmark
- Subscribe
- Mute
- Subscribe to RSS Feed
- Permalink
- Report Inappropriate Content
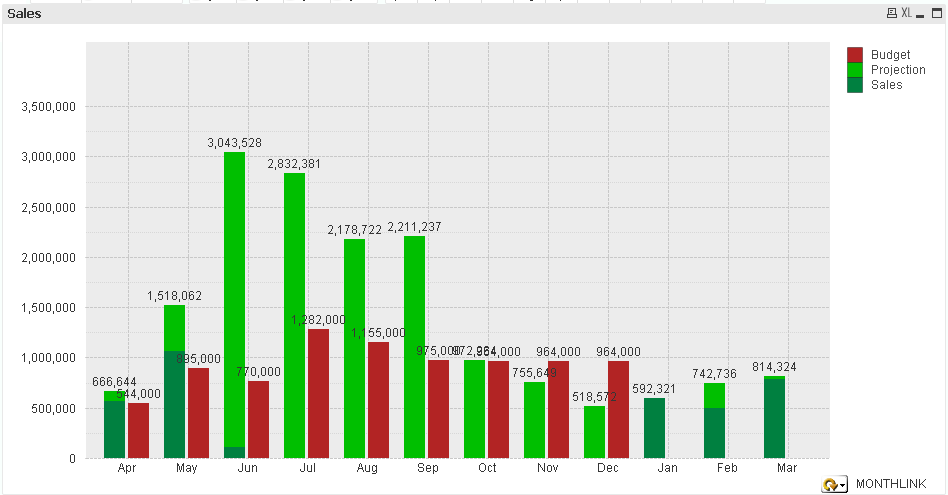
Hi Jayanthan,
You need to add "TypeID" in dimension of your chart and adjust expression with "Type" so that it will group in "Budget" and "Projection & Sales" category.
Thanks
- « Previous Replies
-
- 1
- 2
- Next Replies »