Unlock a world of possibilities! Login now and discover the exclusive benefits awaiting you.
- Qlik Community
- :
- All Forums
- :
- QlikView App Dev
- :
- cycle plot
- Subscribe to RSS Feed
- Mark Topic as New
- Mark Topic as Read
- Float this Topic for Current User
- Bookmark
- Subscribe
- Mute
- Printer Friendly Page
- Mark as New
- Bookmark
- Subscribe
- Mute
- Subscribe to RSS Feed
- Permalink
- Report Inappropriate Content
cycle plot
Hi
Just a quickie as I don't think this is possible. Is it possible to shoe horn a standard chart to create a cylce plot (http://www.cvast.tuwien.ac.at/sites/default/files/cycleplot-technique.png). I suspect this may only be possible by creating an extension
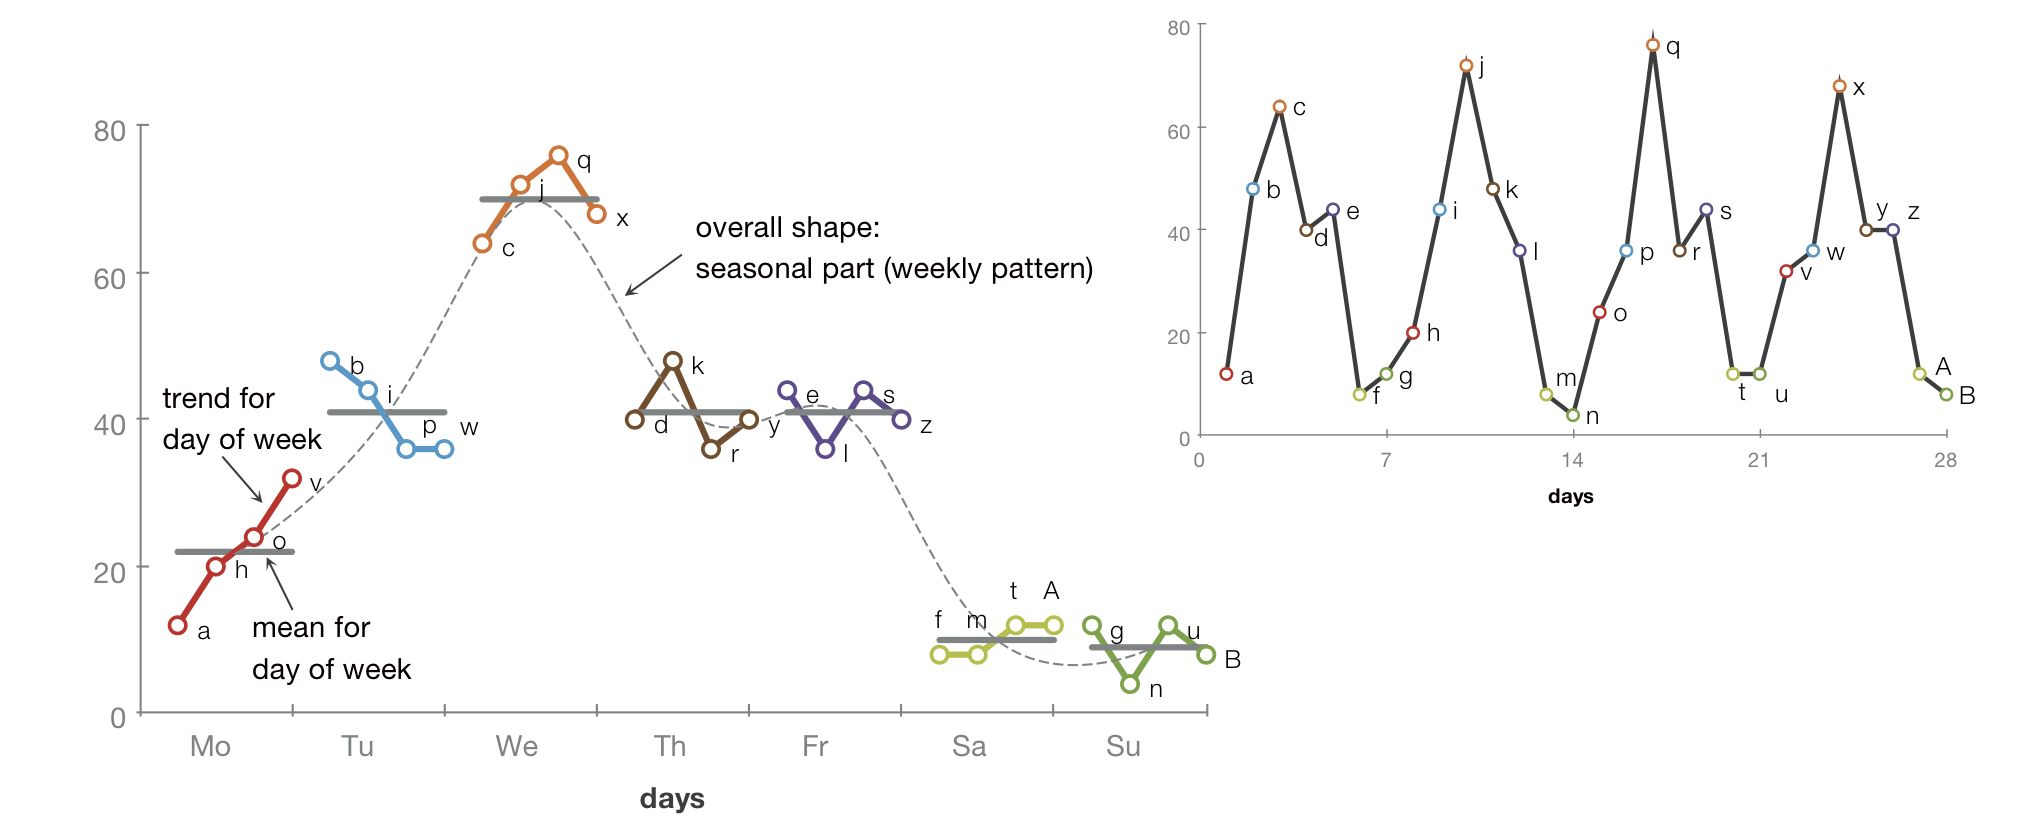
which is beyond my abilities....
Thanks
Oli
PS Not the chart in the top right of the image.
Accepted Solutions
- Mark as New
- Bookmark
- Subscribe
- Mute
- Subscribe to RSS Feed
- Permalink
- Report Inappropriate Content
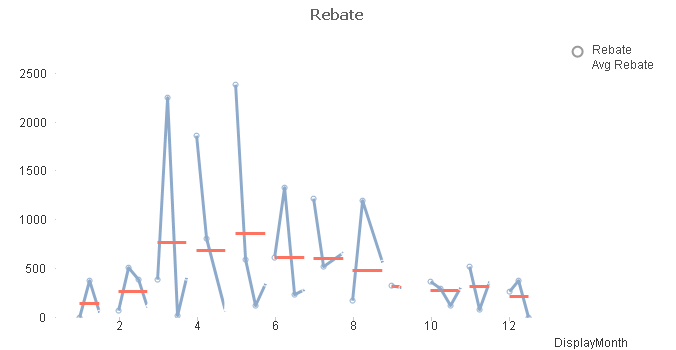
Not sure I like what I produced... 
This chart is tricky since a second dimension in a line chart will be "stacked" and not "grouped" - and you want it grouped. So I had to combine Year and Month into one dimension. And use a color function to "break" the line.
But doing so, creates other problems: I was for instance not able to make the calculations in the UI, but had to precalculate some things in the script.
Hence - a kludgy solution...
HIC
- Mark as New
- Bookmark
- Subscribe
- Mute
- Subscribe to RSS Feed
- Permalink
- Report Inappropriate Content
QlikView can certainly do some of it... Post a data sample, and I'll see how far I can get.
HIC
- Mark as New
- Bookmark
- Subscribe
- Mute
- Subscribe to RSS Feed
- Permalink
- Report Inappropriate Content
Hi Henric
I am honoured 
I have attached some sample data and am really interested to see what you can produce and how.
Thanks
Oli
- Mark as New
- Bookmark
- Subscribe
- Mute
- Subscribe to RSS Feed
- Permalink
- Report Inappropriate Content
Not sure I like what I produced...
This chart is tricky since a second dimension in a line chart will be "stacked" and not "grouped" - and you want it grouped. So I had to combine Year and Month into one dimension. And use a color function to "break" the line.
But doing so, creates other problems: I was for instance not able to make the calculations in the UI, but had to precalculate some things in the script.
Hence - a kludgy solution...
HIC
- Mark as New
- Bookmark
- Subscribe
- Mute
- Subscribe to RSS Feed
- Permalink
- Report Inappropriate Content
You may not be very impressed with your own work; however I think you have done an incredible job with something I believed to be impossible without external help. It shows you know this tool inside and out. I will certainly pick up a few tips from this.
Oli
- Mark as New
- Bookmark
- Subscribe
- Mute
- Subscribe to RSS Feed
- Permalink
- Report Inappropriate Content
Hi
I know it´s been a while since you posted your question but here is a post from my WordPress Blog about using a QlikView extension for Cycle Plots.
The text is in spanish but there are screenshots that you might find interesting.
Link: http://wp.me/p3SltN-b
Best