Unlock a world of possibilities! Login now and discover the exclusive benefits awaiting you.
- Qlik Community
- :
- All Forums
- :
- QlikView App Dev
- :
- Re: different axis preferences for alternative dim...
- Subscribe to RSS Feed
- Mark Topic as New
- Mark Topic as Read
- Float this Topic for Current User
- Bookmark
- Subscribe
- Mute
- Printer Friendly Page
- Mark as New
- Bookmark
- Subscribe
- Mute
- Subscribe to RSS Feed
- Permalink
- Report Inappropriate Content
different axis preferences for alternative dimensions
Hi,
I have a stacked bar chart showing sales. The dimensions are sales and years. thus it shows sales over years- 2016, 2017 and 2018
I added an alternative measure showing % of sales across years by using sum(sales)/ sum(total<dim1>sales)
however since the max on y axis is 100M, when the dimension is chosen as the sum(sales)/ sum(total<dim1>sales) the y axis shows as 100000000%
How do I keep different axes limits for different dimensions?
- Tags:
- axes
- Mark as New
- Bookmark
- Subscribe
- Mute
- Subscribe to RSS Feed
- Permalink
- Report Inappropriate Content
Hi Mallika,
go to Axes tab and select right top option of position for second expression find the snap below
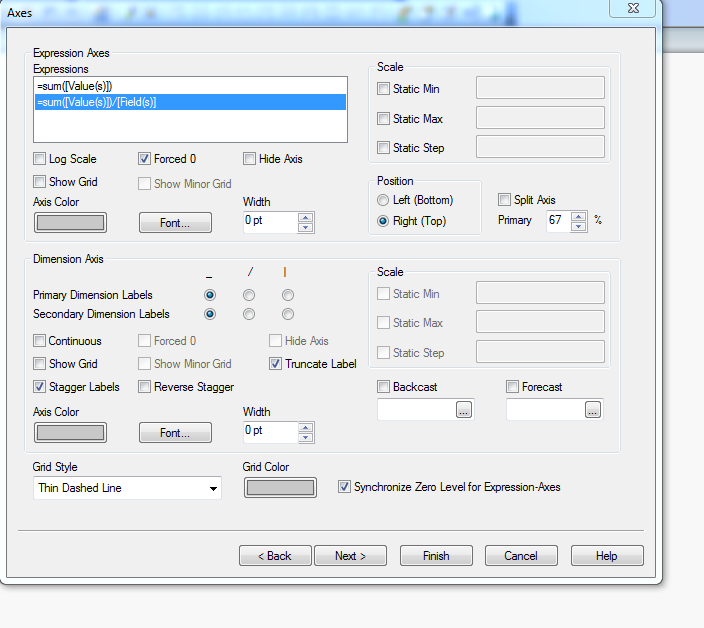
I hope you are looking for this if I understood your query
- Mark as New
- Bookmark
- Subscribe
- Mute
- Subscribe to RSS Feed
- Permalink
- Report Inappropriate Content
Hey i dont have this view, working in qliksense