Unlock a world of possibilities! Login now and discover the exclusive benefits awaiting you.
- Qlik Community
- :
- All Forums
- :
- QlikView App Dev
- :
- Re: how to distinguish two columns in a histogram
- Subscribe to RSS Feed
- Mark Topic as New
- Mark Topic as Read
- Float this Topic for Current User
- Bookmark
- Subscribe
- Mute
- Printer Friendly Page
- Mark as New
- Bookmark
- Subscribe
- Mute
- Subscribe to RSS Feed
- Permalink
- Report Inappropriate Content
how to distinguish two columns in a histogram
Hi everyone,
So I just finished to install Qlikview, and I've got to take over a old project. And here's the deal :
I've got a histogram to make about absenteeism, an average per year. When I pick only one year, it works like a charm (ex 1)
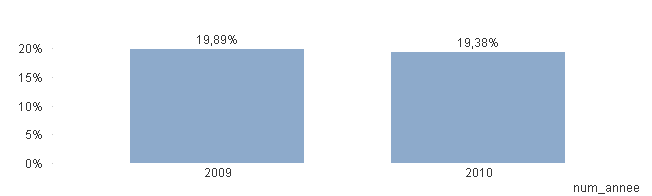
But the problem is when I try to pick 2 years. I would like to see two columns, like the picture ex 2.
Unfortunately, when I try to do that, I don't know why, but I've got an average of something, which leads to the ex 3 picture.
So, the expression on the histogram is : (NUM_JOUR)/((count( {$<NUM_ANNEE = >} AGENT_ID )/12)*365), I don't know if it can help you.
Do you guys have a solution to allow me to separate that in two distinct columns, not linked ? I don't know if it's the expression, or if I have to use anything else, I had read the manual, but I'm not familiar with all the Tools.
Thanks a lot for anyone who can help me !
- Mark as New
- Bookmark
- Subscribe
- Mute
- Subscribe to RSS Feed
- Permalink
- Report Inappropriate Content
Please explain in details what you want to achieve ?
If the issue is solved please mark the answer with Accept as Solution & like it.
If you want to go quickly, go alone. If you want to go far, go together.
- Mark as New
- Bookmark
- Subscribe
- Mute
- Subscribe to RSS Feed
- Permalink
- Report Inappropriate Content
I want the % of absenteeism per year. When I only choose 1 year, it works, I've got the right %, but when I choose 2+ years, it fails. So the thing is, I want (when I choose several years) 2 distincts columns with theirs respectives %, and not an average percentage calculed.
With the screens, it's like : In 2009, we've got 9.51%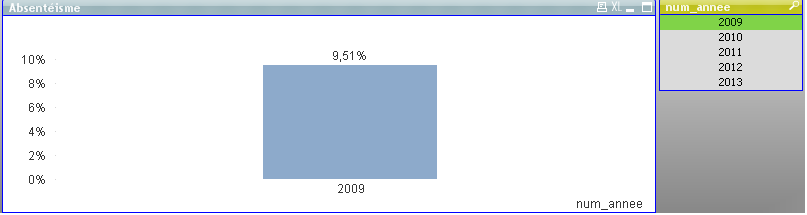
In 2010, we've got 10.23%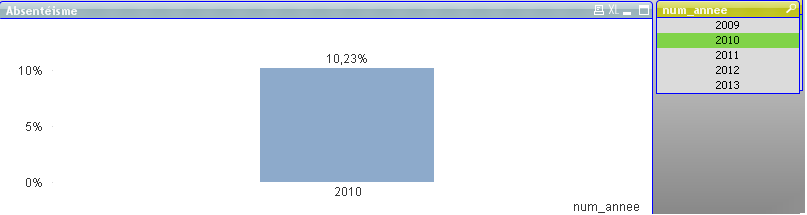
But when I choose both 2009 and 2010, I want the column 2009 to be 9.51% and 2010 10.23%, but that's not the result. And I don't understand why.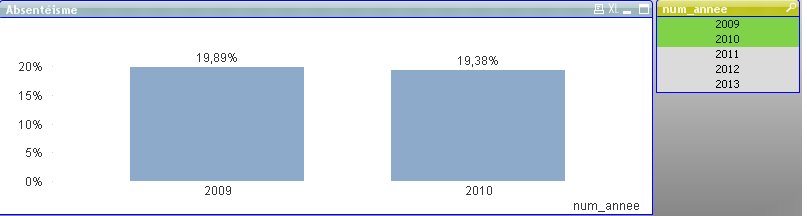
How to put every column dependent of its year ?