Unlock a world of possibilities! Login now and discover the exclusive benefits awaiting you.
- Qlik Community
- :
- All Forums
- :
- QlikView App Dev
- :
- Re: how to give multi dimention pie chart differnt...
- Subscribe to RSS Feed
- Mark Topic as New
- Mark Topic as Read
- Float this Topic for Current User
- Bookmark
- Subscribe
- Mute
- Printer Friendly Page
- Mark as New
- Bookmark
- Subscribe
- Mute
- Subscribe to RSS Feed
- Permalink
- Report Inappropriate Content
how to give multi dimention pie chart differnt color scales.
Anyone knows what to make a pie chart, where the one group (ex. RC_containerType) in one color scale and the other grouping in another color scale(Grouping).
In this example I have done and expression setting the color red if FLT in the background color, but then hole grouping for it change. 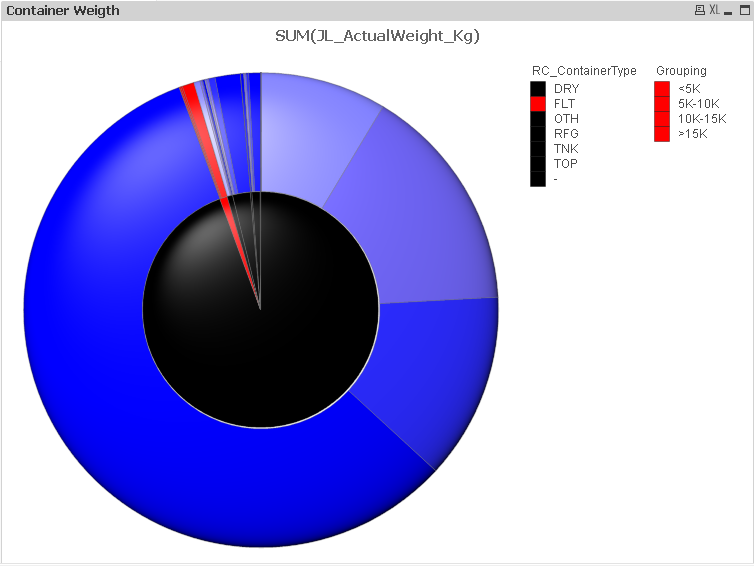
- Mark as New
- Bookmark
- Subscribe
- Mute
- Subscribe to RSS Feed
- Permalink
- Report Inappropriate Content
I'm not sure if this is the answer but have you tried selecting 'persistent colours' on the colours tab in properties? This will give seperate colours to each segment and may achieve what you're after (although I'm not 100% certain without testing).
- Mark as New
- Bookmark
- Subscribe
- Mute
- Subscribe to RSS Feed
- Permalink
- Report Inappropriate Content
Unfortunately not what I'm looking for. If I do the 'persisions colors' and change the a colur, then f.eks. the TOP and <5kg change to green. I want the outer "ring" to be in one color scale like blue, light blue ect, and the inner ring to be yellow, read, green ect.
- Mark as New
- Bookmark
- Subscribe
- Mute
- Subscribe to RSS Feed
- Permalink
- Report Inappropriate Content
- Mark as New
- Bookmark
- Subscribe
- Mute
- Subscribe to RSS Feed
- Permalink
- Report Inappropriate Content
It may be easier to just split the data into two different pie charts - you could even do some sort of toggle button to flick between the two pie charts or just have them side by side, the overlapping isn't a bad idea but that depends on the data and how much it may change.