Unlock a world of possibilities! Login now and discover the exclusive benefits awaiting you.
- Qlik Community
- :
- All Forums
- :
- QlikView App Dev
- :
- Re: how to increase the size of value on data poin...
Options
- Subscribe to RSS Feed
- Mark Topic as New
- Mark Topic as Read
- Float this Topic for Current User
- Bookmark
- Subscribe
- Mute
- Printer Friendly Page
Turn on suggestions
Auto-suggest helps you quickly narrow down your search results by suggesting possible matches as you type.
Showing results for
Not applicable
2016-04-07
05:43 AM
- Mark as New
- Bookmark
- Subscribe
- Mute
- Subscribe to RSS Feed
- Permalink
- Report Inappropriate Content
how to increase the size of value on data points in bar chart
Namaste All
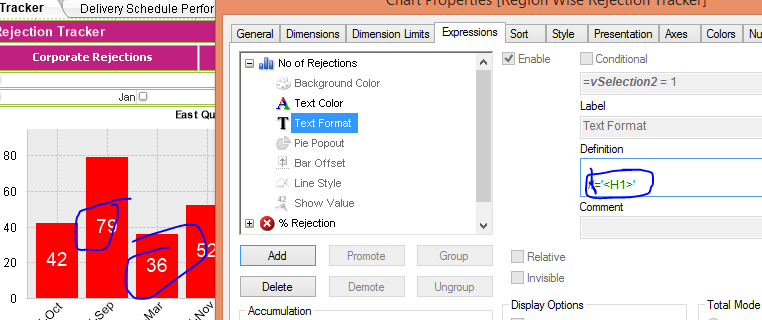
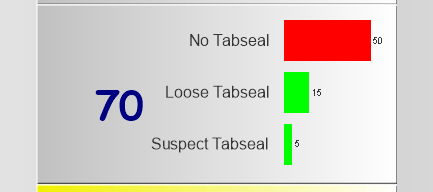
can any one hep me to get increase the size of the values on the bars, may be called as values on data points
here in my below image, 50,15,5..
I would like to increase the font size of those values.
Thanks in advance
2,983 Views
1 Solution
Accepted Solutions
2016-04-07
05:46 AM
- Mark as New
- Bookmark
- Subscribe
- Mute
- Subscribe to RSS Feed
- Permalink
- Report Inappropriate Content
Change the font settings of the expression axis on the Axes tab.
talk is cheap, supply exceeds demand
4 Replies
Partner Ambassador/MVP
2016-04-07
05:45 AM
- Mark as New
- Bookmark
- Subscribe
- Mute
- Subscribe to RSS Feed
- Permalink
- Report Inappropriate Content
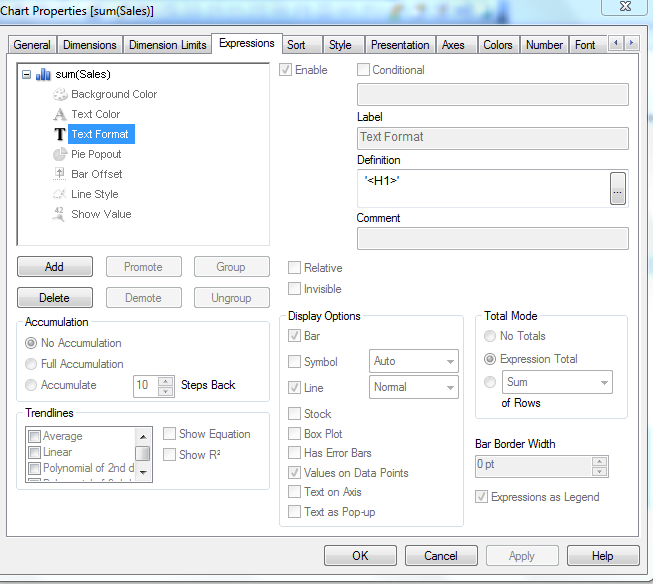
Hi,
You can use below thing.
Go to Expression - >Click on '+' sign next to Expression -> go to Text format and use this expression.
='<H1>'
Regards,
Kaushik Solanki
Please remember to hit the 'Like' button and for helpful answers and resolutions, click on the 'Accept As Solution' button. Cheers!
2016-04-07
05:46 AM
- Mark as New
- Bookmark
- Subscribe
- Mute
- Subscribe to RSS Feed
- Permalink
- Report Inappropriate Content
Change the font settings of the expression axis on the Axes tab.
talk is cheap, supply exceeds demand
Creator
2016-04-07
05:59 AM
- Mark as New
- Bookmark
- Subscribe
- Mute
- Subscribe to RSS Feed
- Permalink
- Report Inappropriate Content
Both should be work check it once.
MVP
2016-04-07
06:01 AM
- Mark as New
- Bookmark
- Subscribe
- Mute
- Subscribe to RSS Feed
- Permalink
- Report Inappropriate Content
chk dis