Unlock a world of possibilities! Login now and discover the exclusive benefits awaiting you.
- Qlik Community
- :
- All Forums
- :
- QlikView App Dev
- :
- how to show 2 (or more) values for one dimension?
- Subscribe to RSS Feed
- Mark Topic as New
- Mark Topic as Read
- Float this Topic for Current User
- Bookmark
- Subscribe
- Mute
- Printer Friendly Page
- Mark as New
- Bookmark
- Subscribe
- Mute
- Subscribe to RSS Feed
- Permalink
- Report Inappropriate Content
how to show 2 (or more) values for one dimension?
Hi QlikFellaz,
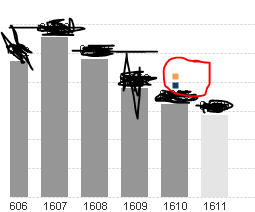
I want to show on combo chart 2 dots for one value on dimension. Let's say that we have periods from 1601 until 1612. There are 2 values for 1610 and i want to show both values as a 2 dots.

Let's say that we have following data:
Field1 Period Value
1 1610 5
2 1610 4
3 1609 6
4 1608 3
5 1607 1
6 1606 2
Like these two above. To achieve this i used two different expressions with set analysis (Field1 = 1 and Field1 = 2) but finally there will be many more so i want to find a solution which avoids creating too many expressions.
Thank you in advace,
Bartek
- Mark as New
- Bookmark
- Subscribe
- Mute
- Subscribe to RSS Feed
- Permalink
- Report Inappropriate Content
Create One more expression for that and give Square use your expression as
Chr(10) & Chr(10) & Sum(Sales)
- Mark as New
- Bookmark
- Subscribe
- Mute
- Subscribe to RSS Feed
- Permalink
- Report Inappropriate Content
Maybe switch to a scatter chart and use a synthetic dimension (serial #)?
For a combo chart, you'll have to define all your expressions somewhere, don't you? Or is it the same expression for all values?
- Mark as New
- Bookmark
- Subscribe
- Mute
- Subscribe to RSS Feed
- Permalink
- Report Inappropriate Content
please post a sample application to demonstrate your issue.
thanks
regards
Marco