Unlock a world of possibilities! Login now and discover the exclusive benefits awaiting you.
- Qlik Community
- :
- All Forums
- :
- QlikView App Dev
- :
- how to show difference between first and last date...
- Subscribe to RSS Feed
- Mark Topic as New
- Mark Topic as Read
- Float this Topic for Current User
- Bookmark
- Subscribe
- Mute
- Printer Friendly Page
- Mark as New
- Bookmark
- Subscribe
- Mute
- Subscribe to RSS Feed
- Permalink
- Report Inappropriate Content
how to show difference between first and last date in pivot table?
Hi,
I have been tearing my hair out trying to get this to work - I have the following pivot table:
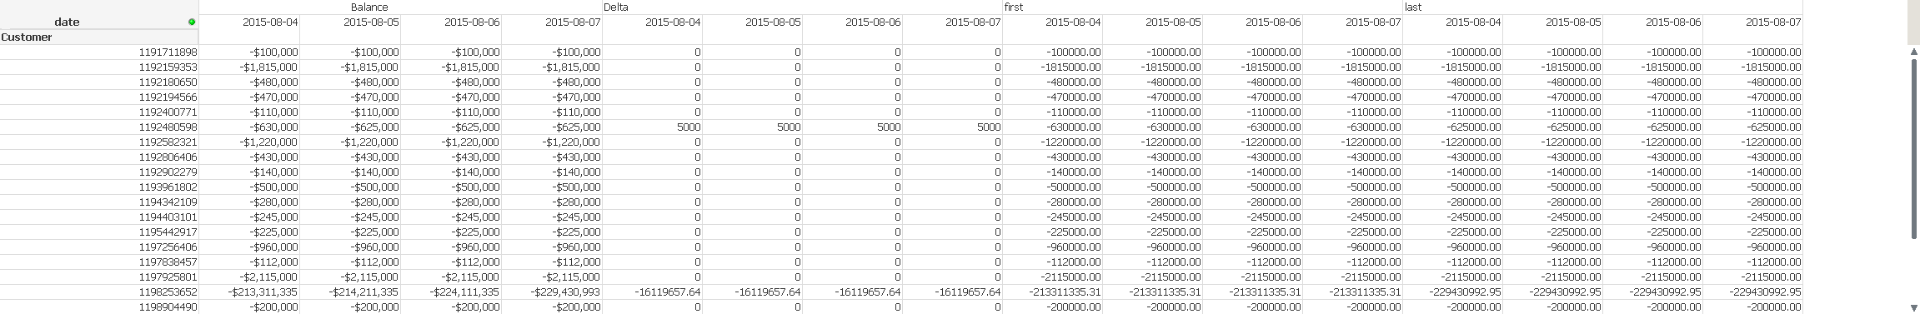
Expressions (across the top) are calculated as follows which are all working in their own right.
balance is sum(balance)
first is (first(sum(Balance))
last is (last(sum(Balance))
Delta is [last]-[first] this is the difference between the value in the last date and the first date in the table.
However, while I am getting the correct values they are not being displayed correctly - nor can I work out how to
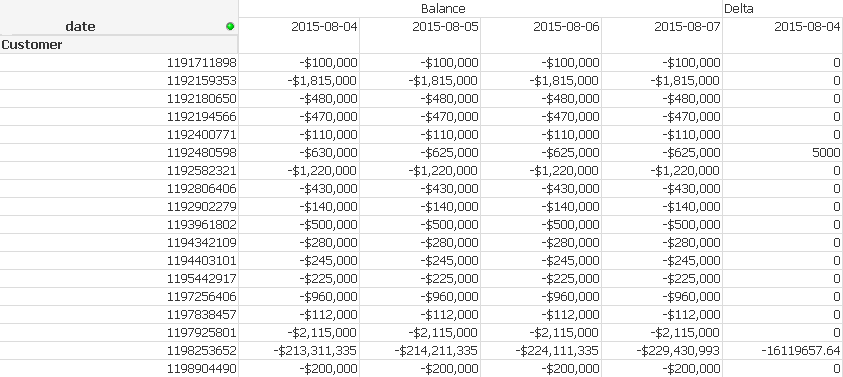
What I need is the table to be presented like this below whereby the dates are all shown under the balance with the difference between the first and last is shown in the column "delta" on it's own without the date dimension repeating the values.
I need the dates but not for the delta column. Please any help appreciated on this.
- Mark as New
- Bookmark
- Subscribe
- Mute
- Subscribe to RSS Feed
- Permalink
- Report Inappropriate Content
Perhaps using a calculated dimension is an option. See attached qvw. If that's not an option you could choose to use a straight table instead with expressions for each date and one for the delta column. Obviously if you want to show a large number of dates this is not practical. You could then choose to use two charts, a pivot table without delta and a straight table with only the delta column, and position these two so they look like one table.
talk is cheap, supply exceeds demand