Unlock a world of possibilities! Login now and discover the exclusive benefits awaiting you.
- Qlik Community
- :
- All Forums
- :
- QlikView App Dev
- :
- Re: last year month figure display in current mont...
- Subscribe to RSS Feed
- Mark Topic as New
- Mark Topic as Read
- Float this Topic for Current User
- Bookmark
- Subscribe
- Mute
- Printer Friendly Page
- Mark as New
- Bookmark
- Subscribe
- Mute
- Subscribe to RSS Feed
- Permalink
- Report Inappropriate Content
last year month figure display in current month
Hi forum, I'm in a deep puzzle.
Hope someone can lend me a hand. Thanks in advance!
Here's the story. I have the testing data as below.
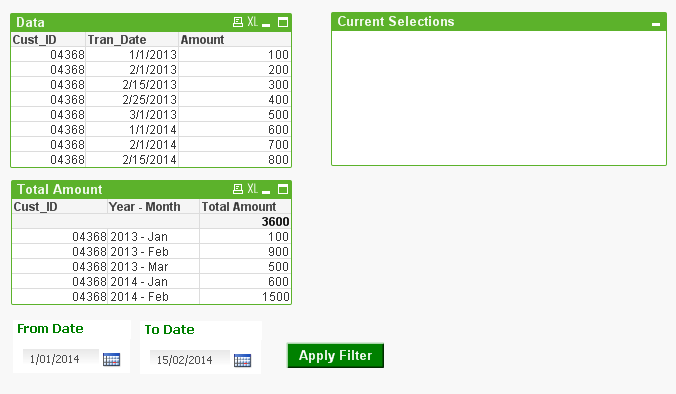
When I press apply filter button. it will set the filtering to retrieve data from 1/1/2014 ~ 2/15/2014.
How can I retrieve the last year figure and display at the same line.
Below's what I expected.
- « Previous Replies
- Next Replies »
- Mark as New
- Bookmark
- Subscribe
- Mute
- Subscribe to RSS Feed
- Permalink
- Report Inappropriate Content
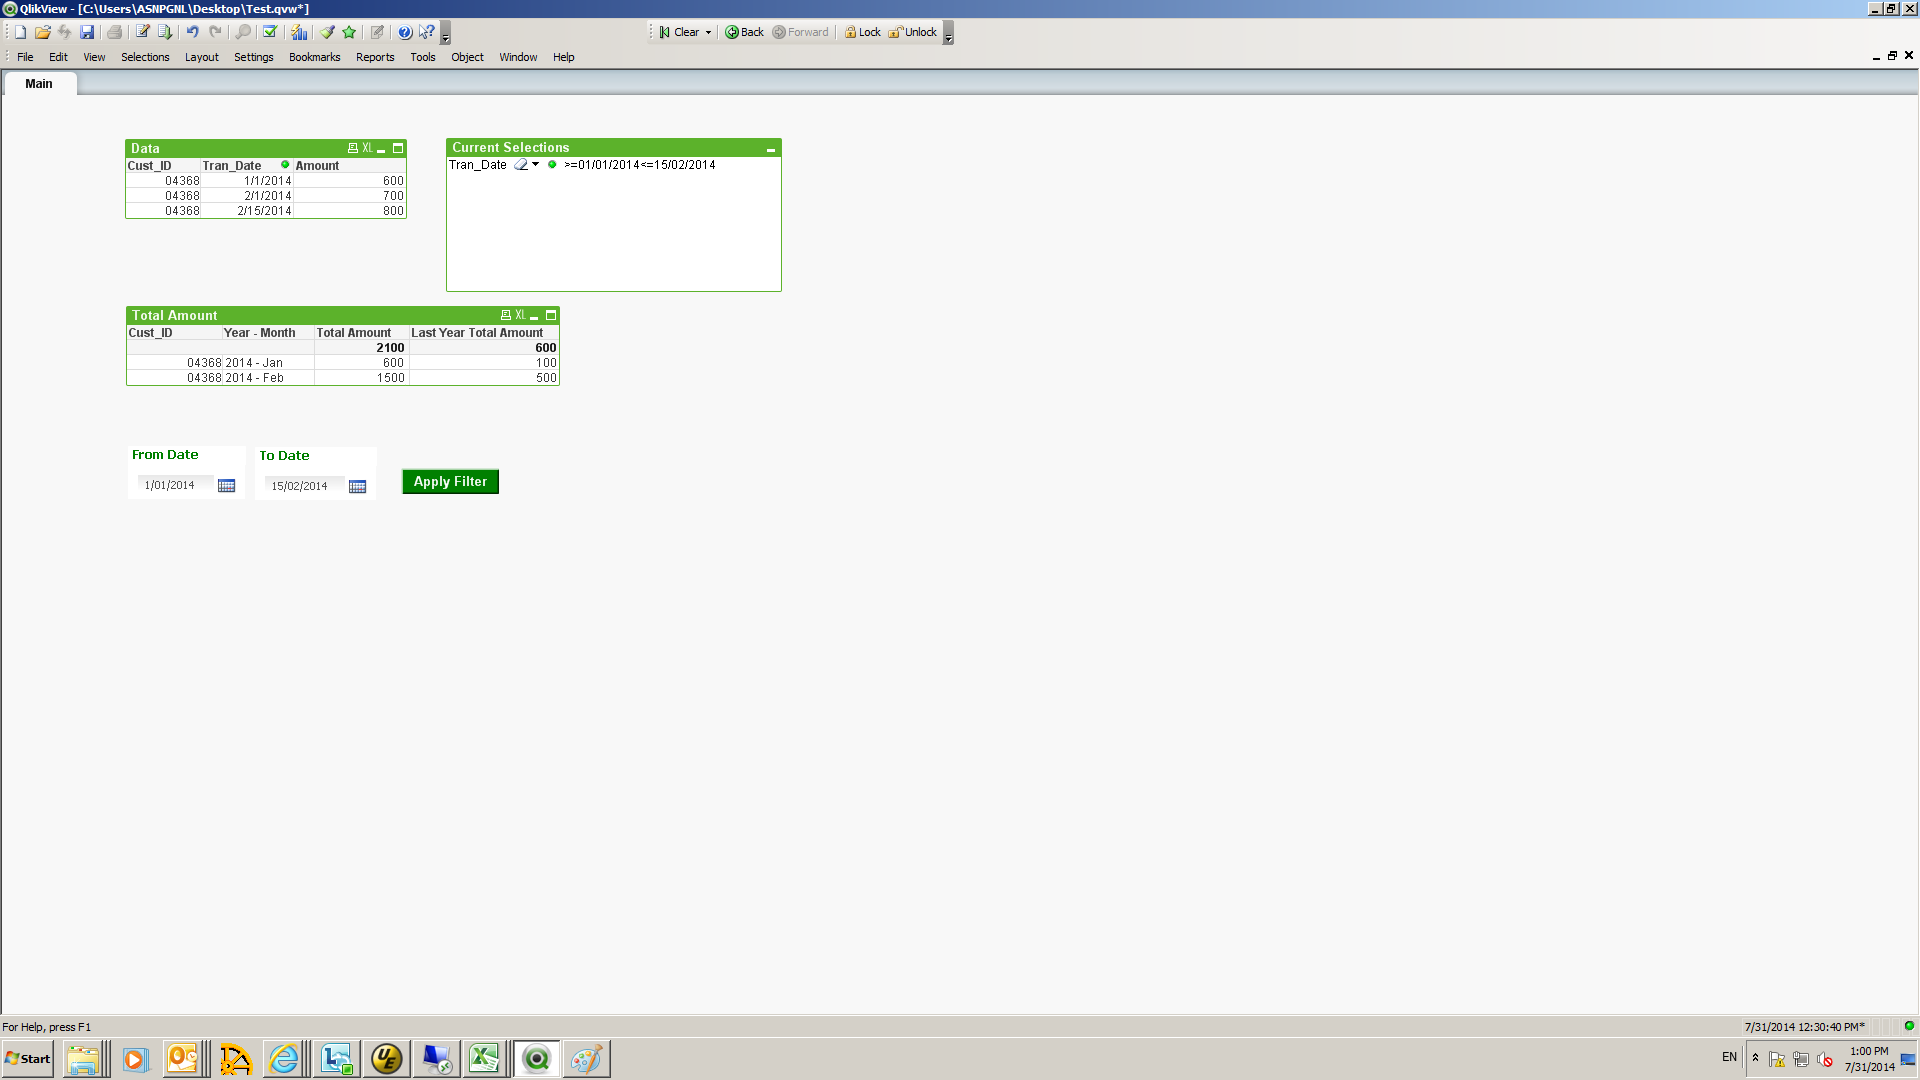
Hi Kelvin,
PFA. According to this data model it's max I can achieve.
I can suggest you to use Master Calendar in your application and look through this article.
http://community.qlik.com/blogs/qlikviewdesignblog/2014/03/03/ytd
Hope this helps.
Andrei
- Mark as New
- Bookmark
- Subscribe
- Mute
- Subscribe to RSS Feed
- Permalink
- Report Inappropriate Content
Hi,
Chk the attached App.
Tatz all i cud do to get wat u nided.....
Regardz,
Vaibz 😉
- Mark as New
- Bookmark
- Subscribe
- Mute
- Subscribe to RSS Feed
- Permalink
- Report Inappropriate Content
see the attched and create your idea as per this sample
- Mark as New
- Bookmark
- Subscribe
- Mute
- Subscribe to RSS Feed
- Permalink
- Report Inappropriate Content
Hi Andrei,
Thanks for your reply.
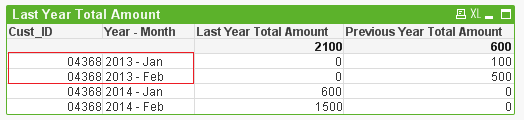
But I don't want 2013's figure show in the chart.
- Mark as New
- Bookmark
- Subscribe
- Mute
- Subscribe to RSS Feed
- Permalink
- Report Inappropriate Content
Hi,
Thanks for reply.
I don't want them in different objects.
Any ideas?
- Mark as New
- Bookmark
- Subscribe
- Mute
- Subscribe to RSS Feed
- Permalink
- Report Inappropriate Content

- Mark as New
- Bookmark
- Subscribe
- Mute
- Subscribe to RSS Feed
- Permalink
- Report Inappropriate Content
Hi,
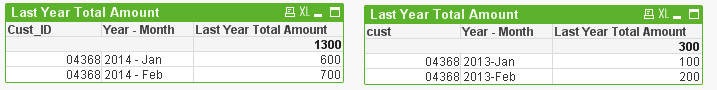
I simply changed Andrei's Version and added a Month Field in skript.
THen we use the month as dimension and you can see the values for the current and the last year separately.
See qvw attached...
Hope this is what you were looking for.
Kind regards,
Anthony
- Mark as New
- Bookmark
- Subscribe
- Mute
- Subscribe to RSS Feed
- Permalink
- Report Inappropriate Content
Hi,
I simply changed Andrei's Version and added a Month Field in skript.
THen we use the month as dimension and you can see the values for the current and the last year separately.

See qvw attached...
Hope this is what you were looking for.
Kind regards,
Anthony
- Mark as New
- Bookmark
- Subscribe
- Mute
- Subscribe to RSS Feed
- Permalink
- Report Inappropriate Content
Hi Anthony,
I need to have year & month in dimension, as I will have cross year data. So only have months in dimension is not enough. Thanks for your idea. Any other thoughts?
- « Previous Replies
- Next Replies »