Unlock a world of possibilities! Login now and discover the exclusive benefits awaiting you.
- Qlik Community
- :
- All Forums
- :
- QlikView App Dev
- :
- Re: populate all dates in a pivot table
- Subscribe to RSS Feed
- Mark Topic as New
- Mark Topic as Read
- Float this Topic for Current User
- Bookmark
- Subscribe
- Mute
- Printer Friendly Page
- Mark as New
- Bookmark
- Subscribe
- Mute
- Subscribe to RSS Feed
- Permalink
- Report Inappropriate Content
populate all dates in a pivot table
Hello
got 2 tables (transactions and master calendar)
both tables are linked by the date field
I have a pivot table with on dimension (date)
and 1 expression
what I want is the following
I select a range of dates say 1/1/2015 till 31/1/2015
now I have 2 transactions in 15/1/2015 and 17/1/2015
however I want the pivot table to display all the dates from 1/1/2015 till 31/1/2015 and so for the dates with no transactions I want to display zeros
Please advise
- « Previous Replies
-
- 1
- 2
- Next Replies »
- Mark as New
- Bookmark
- Subscribe
- Mute
- Subscribe to RSS Feed
- Permalink
- Report Inappropriate Content
If your Dimension Table has all dates need just uncheck "Supress Zero Values" at Presentation tab
- Mark as New
- Bookmark
- Subscribe
- Mute
- Subscribe to RSS Feed
- Permalink
- Report Inappropriate Content
When you create the master calendar problably you are inputing only dates in transaction table.
Try this:
//Store the max data from transactions and min data from transactions
minMaxData:
Load
Num(Daystart(Min(DataField))) AS minData,
Num(Daystart(Max(DataField))) AS maxData
Resident
TransactionsTable
;
//Put the values into two variables
minData = Num(peek('minData'));
maxData = Num(peek('maxData'));
DROP TABLE minMaxData;
//Create Master Calendar with all values
AllData:
Load
$(minData) - 1 + rowno() AS DataField
AutoGenerate
($(maxData) - $(minData))
;
//CALENDAR IS CREATED BASE ON DISTINCT DATA TO INCREASE PERFORMANCE
//CALENDAR DATE IS REGULAR CALENDAR
//FISCAL DATES ARE BASED ON CALENDAR STARTING ON 1ST OF APRIL
// 1/APR/2011 (REGULAR CALENDAR) = 1/01/2012 ON FISCAL CALENDAR
Time:
LOAD
DataField,
MONTH(DataField) AS [Calendar Month],
ceil(MONTH(DataField)/6) as [Calendar Semester],
dual(YEAR(DataField) & '-H' & ceil(MONTH(DataField)/6), YEAR(DataField)*10+ceil (MONTH(DataField)/6)) as [Calendar SemesterYear] ,
ceil(MONTH(DataField)/3) as [Calendar Quarter],
dual(YEAR(DataField) & '-Q' & ceil (MONTH(DataField)/3), YEAR(DataField)*10+ceil (MONTH(DataField)/3)) as [Calendar QuarterYear] ,
num(MONTH(DataField)) AS [Calendar nMonth],
if(num(MONTH(DataField))>3,num( MONTH(DataField))-3, num( MONTH(DataField))+9) AS [Fiscal nMonth],
ceil(if(num( MONTH(DataField))>3,num( MONTH(DataField))-3, num( MONTH(DataField))+9)/3) as [Fiscal Quarter],
ceil( if( num( MONTH(DataField))>3,num( MONTH(DataField))-3, num( MONTH(DataField))+9)/6) as [Fiscal Semester],
dual(if(num( MONTH(DataField))>3,YEAR(DataField)+1, YEAR(DataField)) & '-H' & ceil( if( num( MONTH(DataField))>3,num( MONTH(DataField))-3, num( MONTH(DataField))+9)/6),
if( num( MONTH(DataField))>3,YEAR(DataField)+1, YEAR(DataField))*10+ceil( if( num( MONTH(DataField))>3,num( MONTH(DataField))-3, num( MONTH(DataField))+9)/6)) as [Fiscal SemesterYear] ,
dual( if( num( MONTH(DataField))>3,YEAR(DATA)+1, YEAR(DataField)) & '-Q' & ceil( if( num( MONTH(DataField))>3,num( MONTH(DataField))-3, num( MONTH(DataField))+9)/3),
if( num( MONTH(DataField))>3,YEAR(DataField)+1, YEAR(DataField))*10+ceil( if( num( MONTH(DataField))>3,num( MONTH(DataField))-3, num( MONTH(DataField))+9)/3)) as [Fiscal QuarterYear] ,
NUM(DataField) AS nDataField,
YEAR(DataField) AS [Calendar Year],
if( num( MONTH(DataField))>3,YEAR(DataField)+1, YEAR(DataField)) as [Fiscal Year],
MONTHSTART(DataField) as [Calendar Period],
if( num( MONTH(DataField))>3,
num(num( MONTH(DataField))-3,'00') & YEAR(DataField)+1,
num(num( MONTH(DataField))+9,'00') & YEAR(DataField)) AS [Fiscal Period]
RESIDENT
AllData
;
drop table AllData;
Also you need to enable the 'Show All Values' item on the Dimensions.
Hope it helps.
- Mark as New
- Bookmark
- Subscribe
- Mute
- Subscribe to RSS Feed
- Permalink
- Report Inappropriate Content
Hi Ali, in presentation tab, uncheck 'Supress zero values'. or upload a sample to check what other conditions are affecting.
For a simple sample it works just with that, PFA.
- Mark as New
- Bookmark
- Subscribe
- Mute
- Subscribe to RSS Feed
- Permalink
- Report Inappropriate Content
I did that but it is not working
in the calendar I have all dates
but in Trx not all dates have transactions
- Mark as New
- Bookmark
- Subscribe
- Mute
- Subscribe to RSS Feed
- Permalink
- Report Inappropriate Content
look in the transactions table I have a field called flag
and in my expression I have put a condition on the flag
sum({<flag={1}>}sales)
- Mark as New
- Bookmark
- Subscribe
- Mute
- Subscribe to RSS Feed
- Permalink
- Report Inappropriate Content
Can you try?:
Sum({<flag={1}>} sales)+Sum(0)
- Mark as New
- Bookmark
- Subscribe
- Mute
- Subscribe to RSS Feed
- Permalink
- Report Inappropriate Content
would you mind sharing a sample of your app?
Preparing examples for Upload - Reduction and Data Scrambling
- Mark as New
- Bookmark
- Subscribe
- Mute
- Subscribe to RSS Feed
- Permalink
- Report Inappropriate Content
There is no easy way to show not existing data and each of them have disadvantages.
If you uncheck surpress zero and enabled show all dimension values (by your date) and used then a (more or less complex) condition then you comes near to your wanted results, see:
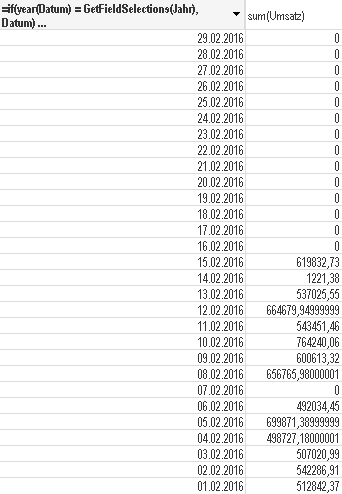
If this isn't sufficient for you you would need to create a carthesian product to create all your missing data either within the script (amounts of data could be very big) or with calculated dimensions and complex expression (performance could be very slow).
- Marcus
- Mark as New
- Bookmark
- Subscribe
- Mute
- Subscribe to RSS Feed
- Permalink
- Report Inappropriate Content
doing this will display all days of calendar
while I only want to display dates that are within the bracket of dates i'm selecting
SUM
(
{
<
[MOVEMENT FLAG]={'00'}
,FLAG={'RECEPTION'}
,S2TCNT = {'P'}
,Year=
,Month=
,Day=
// ,PeriodDate=
,PeriodDate={">= $(vFromDate) <=$(vToDate)"}
>
}S2QCNT
)
- « Previous Replies
-
- 1
- 2
- Next Replies »