Unlock a world of possibilities! Login now and discover the exclusive benefits awaiting you.
- Qlik Community
- :
- All Forums
- :
- QlikView App Dev
- :
- Re: select value from listbox
- Subscribe to RSS Feed
- Mark Topic as New
- Mark Topic as Read
- Float this Topic for Current User
- Bookmark
- Subscribe
- Mute
- Printer Friendly Page
- Mark as New
- Bookmark
- Subscribe
- Mute
- Subscribe to RSS Feed
- Permalink
- Report Inappropriate Content
select value from listbox
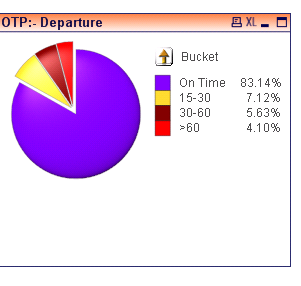
suppose i have 4 values in listbox named as bucket having values as on Time,15-30,30-60,>60
i want to create a chart only for on time,what will be the expression in calculated dimension
- « Previous Replies
-
- 1
- 2
- Next Replies »
- Mark as New
- Bookmark
- Subscribe
- Mute
- Subscribe to RSS Feed
- Permalink
- Report Inappropriate Content
i tried if(wildmatch(Bucket,'On Time')Bucket)
But it won't work,display wrong result
- Mark as New
- Bookmark
- Subscribe
- Mute
- Subscribe to RSS Feed
- Permalink
- Report Inappropriate Content
Hi
Try like this in expression
=Sum({<Bucket = {'On Time'}>}Sales)
Please close the thread by marking correct answer & give likes if you like the post.
- Mark as New
- Bookmark
- Subscribe
- Mute
- Subscribe to RSS Feed
- Permalink
- Report Inappropriate Content
You don't have to use a calculated dimension here: define the scope of the analysis in the expression like this:
=Sum({<Bucket = {'On Time'}>} Value)
- Mark as New
- Bookmark
- Subscribe
- Mute
- Subscribe to RSS Feed
- Permalink
- Report Inappropriate Content
if want to display airline?
- Mark as New
- Bookmark
- Subscribe
- Mute
- Subscribe to RSS Feed
- Permalink
- Report Inappropriate Content
Use airline as dimension and the above expression for the data values. That way only airlines that were 'On Time' wil be displayed
- Mark as New
- Bookmark
- Subscribe
- Mute
- Subscribe to RSS Feed
- Permalink
- Report Inappropriate Content
Try this in calculated dimension side
aggr(only({<Bucket = {'On Time'}>} airline),airline)
check on suppress null value
- Mark as New
- Bookmark
- Subscribe
- Mute
- Subscribe to RSS Feed
- Permalink
- Report Inappropriate Content
not useful for me
- Mark as New
- Bookmark
- Subscribe
- Mute
- Subscribe to RSS Feed
- Permalink
- Report Inappropriate Content
i have already created chart
dimension:
 expression:
Expression
=Count( {<FlightType={'Departure'},FlightDestType={'International','Domestic'} >} IF(WildMatch(NatureCode,'*1*','*8*','*5*'), FLNO))
if i selected indigo flight it display
the new requirement is ,I have to create a new chart for only On Time
for this i used the following
Expression
=(Count( {<Bucket={'On Time'},FlightType={'Departure'},FlightDestType={'Domestic'} >} IF(WildMatch(NatureCode,'*1*','*8*','*5*'), FLNO)))
dimension
=Aggr(Only({<Bucket_new={'On Time'}>}AirlineName),AirlineName)
but selction of indigo and other flight it display wrong result as compare to other
like in indigo
it show 100% instead of 91%
Any sugg??
- Mark as New
- Bookmark
- Subscribe
- Mute
- Subscribe to RSS Feed
- Permalink
- Report Inappropriate Content
Use
=Count({<Bucket = {'On Time'}>} Airlines)
This will give you the count of the number times an airlines was on time.
Plot this against the Airlines name.
- « Previous Replies
-
- 1
- 2
- Next Replies »