Unlock a world of possibilities! Login now and discover the exclusive benefits awaiting you.
- Qlik Community
- :
- All Forums
- :
- QlikView App Dev
- :
- set analysis to get totals data by month
- Subscribe to RSS Feed
- Mark Topic as New
- Mark Topic as Read
- Float this Topic for Current User
- Bookmark
- Subscribe
- Mute
- Printer Friendly Page
- Mark as New
- Bookmark
- Subscribe
- Mute
- Subscribe to RSS Feed
- Permalink
- Report Inappropriate Content
set analysis to get totals data by month
Have a list box for product type, and one for individual products and one for years and one for months.
They can only select one product type at a time, then select one or more products, and any year / months.
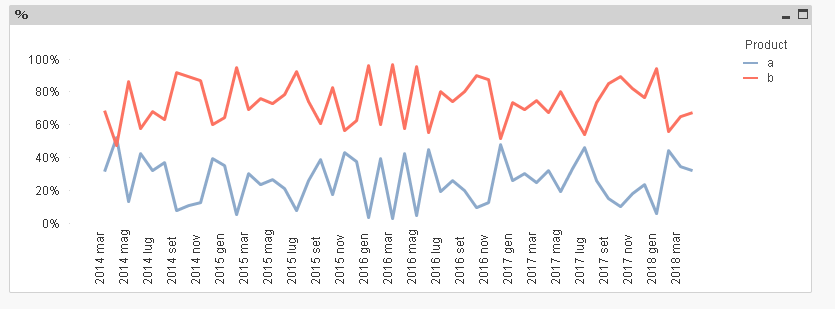
Want to show a line graph for all selected products, with months on x axis, showing by month, the % of sales for the product type that each product has. ( In other words, product sales / total sales for product type).
I assume the graph expression will involve a set analysis statement to pull ALL sales for the selected product type, but I don’t understand how to specify that it should pull the sales totals for each of the individual months being placed on the graph.
I have (with producttype modifier missing):
sum([Sales $]) / sum({1<YearMonth={****}>}[Sales $]) .
What needs to replace the * ?
Thanks for any help you can offer!
Accepted Solutions
- Mark as New
- Bookmark
- Subscribe
- Mute
- Subscribe to RSS Feed
- Permalink
- Report Inappropriate Content
hope I understand: to disregard Product selection
sum(Expression1) / sum({$ <Product=>} total <YearMonth> Expression1)
- Mark as New
- Bookmark
- Subscribe
- Mute
- Subscribe to RSS Feed
- Permalink
- Report Inappropriate Content
not sure I understand,
assuming you want a line chart with YearMonth and Product as dimension
sum(Expression1) / sum(total <YearMonth> Expression1)
- Mark as New
- Bookmark
- Subscribe
- Mute
- Subscribe to RSS Feed
- Permalink
- Report Inappropriate Content
Thanks Massimo, but what I need is the total sales for that product being divided by the total sales of ALL products of the same product type (not just those currently selected)
hope that makes sense
- Mark as New
- Bookmark
- Subscribe
- Mute
- Subscribe to RSS Feed
- Permalink
- Report Inappropriate Content
hope I understand: to disregard Product selection
sum(Expression1) / sum({$ <Product=>} total <YearMonth> Expression1)
- Mark as New
- Bookmark
- Subscribe
- Mute
- Subscribe to RSS Feed
- Permalink
- Report Inappropriate Content
Thanks Massimo! it was the TOTAL function that I needed.