Unlock a world of possibilities! Login now and discover the exclusive benefits awaiting you.
- Qlik Community
- :
- All Forums
- :
- QlikView App Dev
- :
- single stack bar
- Subscribe to RSS Feed
- Mark Topic as New
- Mark Topic as Read
- Float this Topic for Current User
- Bookmark
- Subscribe
- Mute
- Printer Friendly Page
- Mark as New
- Bookmark
- Subscribe
- Mute
- Subscribe to RSS Feed
- Permalink
- Report Inappropriate Content
single stack bar
hi
all,
below is my data
| year | month | dept | AMT | ID |
| 2016 | JAN | CSE | 100 | 1 |
| 2016 | FEB | IT | 200 | 2 |
| 2016 | MAR | EEE | 300 | 3 |
| 2016 | APR | CSE | 400 | 4 |
| 2015 | JAN | CSE | 500 | |
| 2015 | FEB | IT | 600 | |
| 2015 | MAR | EEE | 700 | |
| 2015 | APR | CSE | 800 | 10 |
| 2015 | MAY | EEE | 900 | 1 |
| 2015 | JUNE | CSE | 1000 | 12 |
now i need the single bar chart of null and null values record count. how to achieve it?
where in the single bar it should differentiate the null and non null values
- « Previous Replies
-
- 1
- 2
- Next Replies »
- Mark as New
- Bookmark
- Subscribe
- Mute
- Subscribe to RSS Feed
- Permalink
- Report Inappropriate Content
Create a Flag inside Script something like this..
IF(IsNull(ID) or Len(TRIM(ID)) = 0, 'Null','NotNull') as IsNullFlag
Now you can use something like below
COUNT({<IsNullFlag = {'Null'}>}ID)
COUNT({<IsNullFlag = {'NotNull'}>}ID)
- Mark as New
- Bookmark
- Subscribe
- Mute
- Subscribe to RSS Feed
- Permalink
- Report Inappropriate Content
i m asking how to do it in chart of design.
- Mark as New
- Bookmark
- Subscribe
- Mute
- Subscribe to RSS Feed
- Permalink
- Report Inappropriate Content
Something like this:
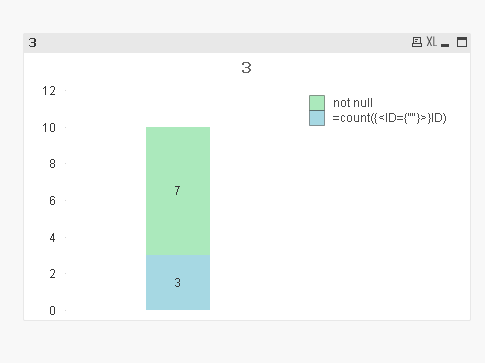
exp:1 =count({<ID={""}>}ID)
exp:2 =count(Total ID)-count({<ID={""}>}ID)
- Mark as New
- Bookmark
- Subscribe
- Mute
- Subscribe to RSS Feed
- Permalink
- Report Inappropriate Content
expression i can easily use it, but in the graph how to show it in single bar chart
- Mark as New
- Bookmark
- Subscribe
- Mute
- Subscribe to RSS Feed
- Permalink
- Report Inappropriate Content
yes can u attach the file for me
- Mark as New
- Bookmark
- Subscribe
- Mute
- Subscribe to RSS Feed
- Permalink
- Report Inappropriate Content
varsha can u attach the file for me
- Mark as New
- Bookmark
- Subscribe
- Mute
- Subscribe to RSS Feed
- Permalink
- Report Inappropriate Content
Try this.
- Mark as New
- Bookmark
- Subscribe
- Mute
- Subscribe to RSS Feed
- Permalink
- Report Inappropriate Content
Don't use any dimension..
use two expressions I have suggested
go to Style tab and select stacked..
- Mark as New
- Bookmark
- Subscribe
- Mute
- Subscribe to RSS Feed
- Permalink
- Report Inappropriate Content
so we should use stacked bar right in style ?
- « Previous Replies
-
- 1
- 2
- Next Replies »