Unlock a world of possibilities! Login now and discover the exclusive benefits awaiting you.
- Qlik Community
- :
- All Forums
- :
- QlikView App Dev
- :
- static bar width
- Subscribe to RSS Feed
- Mark Topic as New
- Mark Topic as Read
- Float this Topic for Current User
- Bookmark
- Subscribe
- Mute
- Printer Friendly Page
- Mark as New
- Bookmark
- Subscribe
- Mute
- Subscribe to RSS Feed
- Permalink
- Report Inappropriate Content
static bar width
How to do the static bar width in bar chart for example
- Mark as New
- Bookmark
- Subscribe
- Mute
- Subscribe to RSS Feed
- Permalink
- Report Inappropriate Content
use DUAL() function
example
Dual( num(10000,'$ #,##0') , 10)
will scale the bar to height 10,,...you cannot control the width of the bar,
If a post helps to resolve your issue, please accept it as a Solution.
- Mark as New
- Bookmark
- Subscribe
- Mute
- Subscribe to RSS Feed
- Permalink
- Report Inappropriate Content
Hi Ashok, not static but in Chart properties -> Presentation tab, you can enable the option to 'Show scrollbar on X axis', this allows to set a maximum number of elements, so the bars always have a minimum widht.
The bars can grow bigger if the chart has to paint less bars than the value set for enable scrollbar, in this case they will grow to occupy the widht of the chart.
In some charts the number of bars can be fixed (so the widht remains the same) but only a few situatons allows to apply this kind of solution.
- Mark as New
- Bookmark
- Subscribe
- Mute
- Subscribe to RSS Feed
- Permalink
- Report Inappropriate Content
Hi Ruben,
Actual my requirement is this is my data
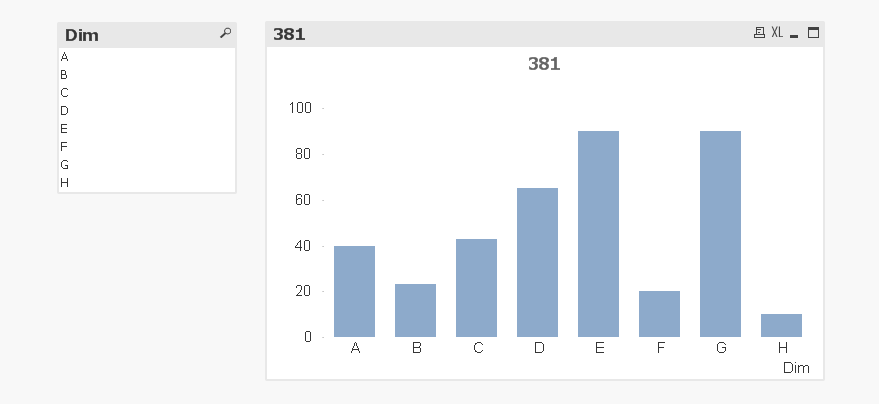
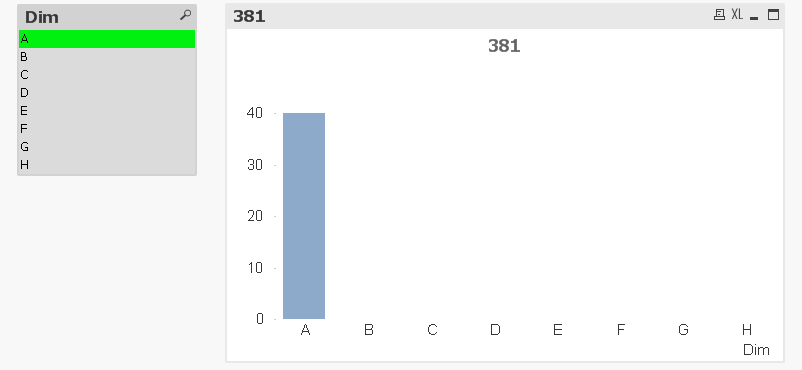
but I want like this output
- Mark as New
- Bookmark
- Subscribe
- Mute
- Subscribe to RSS Feed
- Permalink
- Report Inappropriate Content
In that case you can enable the option to 'Show all values' in dimension tab, and uncheck the option to 'supress zero values' in presentation tab.
- Mark as New
- Bookmark
- Subscribe
- Mute
- Subscribe to RSS Feed
- Permalink
- Report Inappropriate Content
How to derive the quarters like
Jan,Nov,Dec-Q1,Feb,Mar,Apr-Q2,May,June,July-Q3,Aug,Sep,Oct-Q4 and every quarter have 13 weeks
like week numbers Q1-1to 13 ,Q2-1 TO 13