Unlock a world of possibilities! Login now and discover the exclusive benefits awaiting you.
- Qlik Community
- :
- All Forums
- :
- QlikView App Dev
- :
- stock vintages help on lines chart
- Subscribe to RSS Feed
- Mark Topic as New
- Mark Topic as Read
- Float this Topic for Current User
- Bookmark
- Subscribe
- Mute
- Printer Friendly Page
- Mark as New
- Bookmark
- Subscribe
- Mute
- Subscribe to RSS Feed
- Permalink
- Report Inappropriate Content
stock vintages help on lines chart
Hi all!
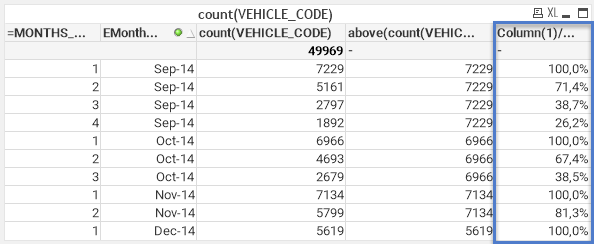
I'm trying to get this info:
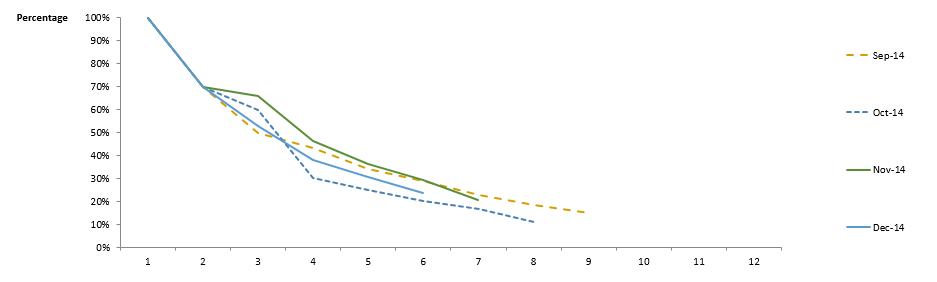
In order to get it to look like this chart:
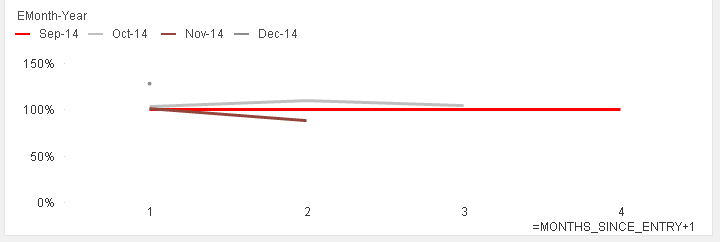
But i'm only getting this:
I'm Stucked, i've tried everything
Can anyone help me? it seems above is not working on lines chart.
Thanks a lot!
Dai
- Mark as New
- Bookmark
- Subscribe
- Mute
- Subscribe to RSS Feed
- Permalink
- Report Inappropriate Content
Hi,
You can try to change the Scale Value like the below screen shot.. and sort the value based on Month..

- Mark as New
- Bookmark
- Subscribe
- Mute
- Subscribe to RSS Feed
- Permalink
- Report Inappropriate Content
Hi There
can you attach your sample qvw along with sample data to fix the problem
Sreeni
- Mark as New
- Bookmark
- Subscribe
- Mute
- Subscribe to RSS Feed
- Permalink
- Report Inappropriate Content
Hi, There you go. Let me know if you don’t understand the task!
Best regards
Dai
De: Jd Sreeni
Enviado el: lunes, 5 de octubre de 2015 6:20
Para: Daiana Rossignol <daiana.rossignol@insiemeit.es>
Asunto: Re: - stock vintages help on lines chart
<https://community.qlik.com/resources/images/palette-1004/headerLogo-1391206184624-QlikCommunity_logo.gif>
- Mark as New
- Bookmark
- Subscribe
- Mute
- Subscribe to RSS Feed
- Permalink
- Report Inappropriate Content
Anyone please??
I don't understand why something that can be done as a summarized table it cannot be done on a line chart.
When I turn it to chart i just breaks.
I'm stucked here please!
BR
Dai
- Mark as New
- Bookmark
- Subscribe
- Mute
- Subscribe to RSS Feed
- Permalink
- Report Inappropriate Content
Hello! any new on this? please, i don't understand why when i change the chart to table it doesn't work.
Or maybe there is a different way of doing it?
BR
Daiana