Unlock a world of possibilities! Login now and discover the exclusive benefits awaiting you.
- Qlik Community
- :
- All Forums
- :
- QlikView App Dev
- :
- sum across an column
- Subscribe to RSS Feed
- Mark Topic as New
- Mark Topic as Read
- Float this Topic for Current User
- Bookmark
- Subscribe
- Mute
- Printer Friendly Page
- Mark as New
- Bookmark
- Subscribe
- Mute
- Subscribe to RSS Feed
- Permalink
- Report Inappropriate Content
sum across an column
hi,
i am looking to sum across all values in the last column (# of Ads)
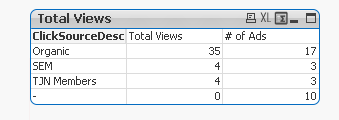
my goal is to sum all values in the last column, like this:
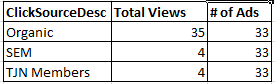
is there a waqy to do this?
Accepted Solutions
- Mark as New
- Bookmark
- Subscribe
- Mute
- Subscribe to RSS Feed
- Permalink
- Report Inappropriate Content
Perhaps sum(total aggr(count([# of Ads]),[QlickSourceDesc]))
talk is cheap, supply exceeds demand
- Mark as New
- Bookmark
- Subscribe
- Mute
- Subscribe to RSS Feed
- Permalink
- Report Inappropriate Content
sum( total [# of Ads])
talk is cheap, supply exceeds demand
- Mark as New
- Bookmark
- Subscribe
- Mute
- Subscribe to RSS Feed
- Permalink
- Report Inappropriate Content
it's an id column, so i would like to count it (instead of sum it),
but when i use count, results are the same...
- Mark as New
- Bookmark
- Subscribe
- Mute
- Subscribe to RSS Feed
- Permalink
- Report Inappropriate Content
Perhaps sum(total aggr(count([# of Ads]),[QlickSourceDesc]))
talk is cheap, supply exceeds demand
- Mark as New
- Bookmark
- Subscribe
- Mute
- Subscribe to RSS Feed
- Permalink
- Report Inappropriate Content
worked like a charm!
can you elaborate on it?
i understand the aggr function,
but i don't understand how it works when nested in a total function
- Mark as New
- Bookmark
- Subscribe
- Mute
- Subscribe to RSS Feed
- Permalink
- Report Inappropriate Content
The aggr function works exactly the same as without the total keyword. The total keyword just causes the sum to be calculated disregarding the dimension boundaries of your chart.
talk is cheap, supply exceeds demand
- Mark as New
- Bookmark
- Subscribe
- Mute
- Subscribe to RSS Feed
- Permalink
- Report Inappropriate Content
Hey,
count([# of Ads]) will be equal to number of [QlickSourceDesc] .
Isn't it ??
Thanks
- Mark as New
- Bookmark
- Subscribe
- Mute
- Subscribe to RSS Feed
- Permalink
- Report Inappropriate Content
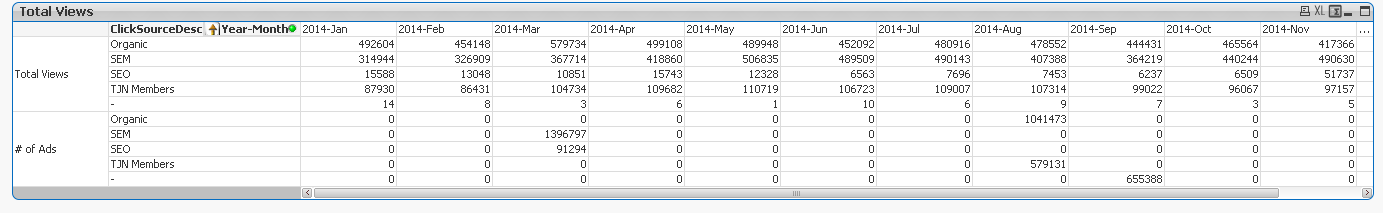
now my problem is that it disregards other dimensions in my chart,
i have tried to drop the "tota" but it doesn't give me any result,
please see:
sum(aggr(count([Ad Counter]), ClickSourceDesc))
- Mark as New
- Bookmark
- Subscribe
- Mute
- Subscribe to RSS Feed
- Permalink
- Report Inappropriate Content
Maybe sum(total <[Year-Month]> aggr(count([Ad Counter]), ClickSourceDesc))
talk is cheap, supply exceeds demand