Unlock a world of possibilities! Login now and discover the exclusive benefits awaiting you.
- Qlik Community
- :
- All Forums
- :
- QlikView App Dev
- :
- Re: top n values in current month comparing to pre...
- Subscribe to RSS Feed
- Mark Topic as New
- Mark Topic as Read
- Float this Topic for Current User
- Bookmark
- Subscribe
- Mute
- Printer Friendly Page
- Mark as New
- Bookmark
- Subscribe
- Mute
- Subscribe to RSS Feed
- Permalink
- Report Inappropriate Content
top n values in current month comparing to previous month
Hi All
please help me out in
Comparing the current month top n values to the previous months
- Tags:
- new to qlikview
- Mark as New
- Bookmark
- Subscribe
- Mute
- Subscribe to RSS Feed
- Permalink
- Report Inappropriate Content
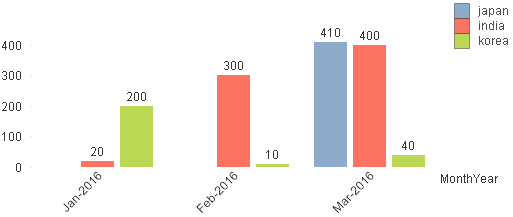
Hi John
When i select the march month, the data is displaying wrong and for the remining months as well.
In march month top 3 are
India, japan and korea
but these values are displaying wrong in the comparision chart
when these values are compared to the previous month, the values are also wrong
can you please help me
i have the as of calender, where i can show the current month data with currentmonth =1 flag
i can able to show the previous 5 months as well with isprevious5 =1 flag ( which you sorted out) in the bel;ow thread
Current month average comparision with previous months average
but when there are only 2 top values in the current month the problem is araising
top 2 values in the current month are displaying as well as other values from other months are also displaying

- Mark as New
- Bookmark
- Subscribe
- Mute
- Subscribe to RSS Feed
- Permalink
- Report Inappropriate Content
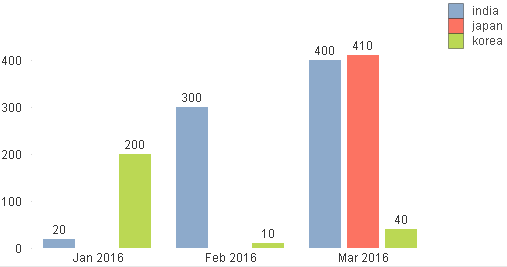
Hi Aurelien,
When i select the march month, the data is displaying wrong and for the remining months as well.
In march month top 3 are
India, japan and korea
but these values are displaying wrong in the comparision chart
when these values are compared to the previous month, the values are also wrong
the top 3 in march should display in previous months as well if there is no data for those countries in previous month show it as null or no bar
top 3 values in the current month are displaying wrong as well as other values from other months are also displaying

- Mark as New
- Bookmark
- Subscribe
- Mute
- Subscribe to RSS Feed
- Permalink
- Report Inappropriate Content
Hi Tesesco
When i select the march month, the data is displaying wrong and for the remining months as well.
In march month top 3 are
India, japan and korea
but these values are displaying wrong in the comparision chart
when these values are compared to the previous month, the values are also wrong
the top 3 in march should display in previous months as well if there is no data for those countries in previous month show it as null or no bar
top 3 values in the current month are displaying wrong as well as other values from other months are also displaying

- Mark as New
- Bookmark
- Subscribe
- Mute
- Subscribe to RSS Feed
- Permalink
- Report Inappropriate Content
Is this what you want for March? I guess you said the 300 is wrong, but I'm unclear why it's wrong. It seems right to me.
To get this chart, I changed the second dimension to this:
=aggr(if(rank(sum({<MonthYear={"$(=max(MonthYear))"}>} Orders),4,1)<=3,country),country)
- Mark as New
- Bookmark
- Subscribe
- Mute
- Subscribe to RSS Feed
- Permalink
- Report Inappropriate Content
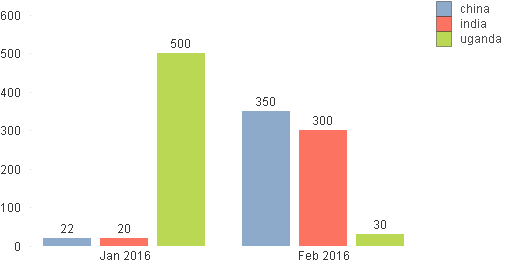
Hi John,
The requiremnt is, what ever the month user selects
The top3 in that month should be shown
and want to see how these top 3 in selcted month are in previous 3 months
for march and feb, it is showing correct results
where as when i select april its again not showing correct results
there is only one value in april ie usa
but in the previous months there is no data for usa so there should be no data shown
but the bar is showing other countries data as well

- Mark as New
- Bookmark
- Subscribe
- Mute
- Subscribe to RSS Feed
- Permalink
- Report Inappropriate Content
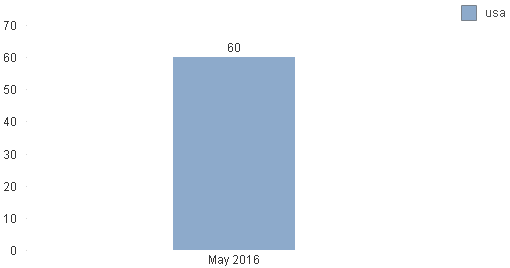
Hi John,
The above expression is working fine for me in all cases expect the below case
if there is only one value in current month, the previous months should also show one value (ie the value which is in current month) else it should not show but with the above expression, the previous months top values are also displaying along with the current values.
in the below chart
i have only 1 order in may and that order is showing in the previous 3 months but along with that the other values are also showing which shouldn't

- Mark as New
- Bookmark
- Subscribe
- Mute
- Subscribe to RSS Feed
- Permalink
- Report Inappropriate Content
OK, I recoded/simplified your Calendar and AsOf script from scratch so that everything was defined and connected more like I'm used to. The chart seems to be working correctly now for all months, if I understand how it's supposed to work. Sorry for all this confusion. You asked for something that seems like it should be so easy, and it's turned out to be so difficult to get right. I sure hope we have it this time.
Dimension 1 = Month
Dimension 2 = Country
Expression = sum({<Country={"=rank(sum({<IsCurrent={1}>} Orders),4,1)<4"}>} Orders)
- Mark as New
- Bookmark
- Subscribe
- Mute
- Subscribe to RSS Feed
- Permalink
- Report Inappropriate Content
Hi John
You are absolute genious, great and the qlik guru, thanks a ton, that solved the problem.
One last thing
= sum({<Country={"=rank(sum({<IsCurrent={1}>} Orders),4,1)<4"}>} Orders)
this gives me the exact results
but i want to always see the last 3 months data when ever i selecta month
ie the isrolling3 flag should be always 1, where can i insert the isrolling3 flag into this setexpression
- Mark as New
- Bookmark
- Subscribe
- Mute
- Subscribe to RSS Feed
- Permalink
- Report Inappropriate Content
Like this:
sum({<IsRolling3={1},Country={"=rank(sum({<IsCurrent={1}>} Orders),4,1)<4"}>} Orders)
- Mark as New
- Bookmark
- Subscribe
- Mute
- Subscribe to RSS Feed
- Permalink
- Report Inappropriate Content
Thank you.... Thank you.... Thank you.... Thank you ..... its working perfect
Can you please xplain me the logic please