Unlock a world of possibilities! Login now and discover the exclusive benefits awaiting you.
- Qlik Community
- :
- All Forums
- :
- QlikView App Dev
- :
- Re: trellis drill down
- Subscribe to RSS Feed
- Mark Topic as New
- Mark Topic as Read
- Float this Topic for Current User
- Bookmark
- Subscribe
- Mute
- Printer Friendly Page
- Mark as New
- Bookmark
- Subscribe
- Mute
- Subscribe to RSS Feed
- Permalink
- Report Inappropriate Content
trellis drill down
Hi folks,
my customer want to use a trellis diagram. we have two dimensions (region, productgroup with region as drill down dimension), 3 expressions in a cycle group.
We use fast change to enable the customer to switch between a pivot table and a barchart with trellis.
in the barchart the trelli is used from regions while the x axis of each chart contain the productgroups (only 7-8, no drill down required).
What doesnot work is to drill down the region while displaying the barchart.
When I switch to pivot table I can drill down and up as I like in the region. It works perfect. I want the same behaviour in the bar charts.
I cannot change the order of the dimension (first product, second region with drill down), as the customer is analyzing by region and selecting
the productgroup (but then drill down and uo into regions works as well).
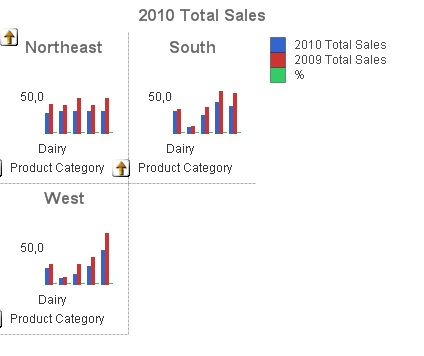
The picture shows a similiar situation. How can I drill into south for detailed areas?
Any ideas? I tried it with v10 sr 1 and on my laptop with V 11 initial release.
Thanks!
- Mark as New
- Bookmark
- Subscribe
- Mute
- Subscribe to RSS Feed
- Permalink
- Report Inappropriate Content
Hi,
I tried it, and I found out, that only selection in the field Region will show you the right data. You can not use the mouse in the chart.
Greetings from Munich
Martina