Unlock a world of possibilities! Login now and discover the exclusive benefits awaiting you.
- Qlik Community
- :
- All Forums
- :
- QlikView App Dev
- :
- union of two query
- Subscribe to RSS Feed
- Mark Topic as New
- Mark Topic as Read
- Float this Topic for Current User
- Bookmark
- Subscribe
- Mute
- Printer Friendly Page
- Mark as New
- Bookmark
- Subscribe
- Mute
- Subscribe to RSS Feed
- Permalink
- Report Inappropriate Content
union of two query
Hi to all, i'm new of this community and thanks for yours help (and sorry for my eng).
I created a QV dashboard and I would like to analyze the UNION of 2 Result Sets with SAME SCHEMA. But (obviously in AQL) when i build a query i can analyze only one result set, and visualize it on Excel.
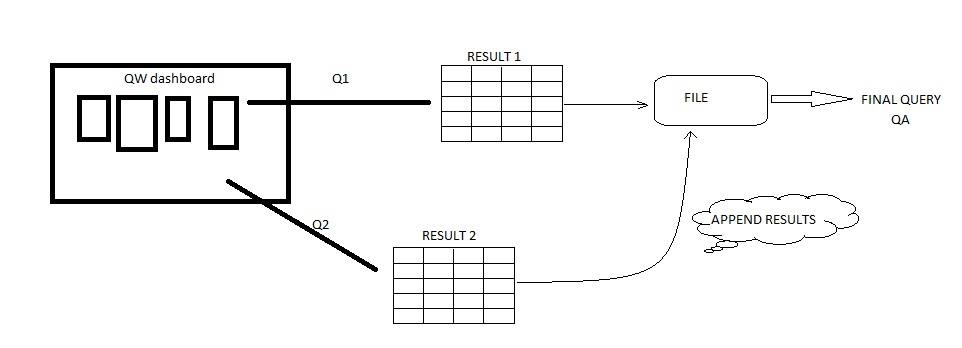
I would like to select some values of this schema: (Gender, Car_type, Age) and i would like to build a query like this Q1: ('MALE', 'FIAT PUNTO', '24'), and this query Q2: ('FEMALE', 'CHRISLER VOIAGER', '31').
The first query (Q1) generates the report (RESULT 1), the second query (Q2) generates the report (RESULT 2).
Question: Is possible to visualize a report like UNION of two other reports with the same schema?
Can be a solution store the result of Q1 in a file and append the result of Q2 in the same file? (the aim is to analyze the final file with a query: QA)
--> if is a solution, How can I implement it???
Thanks a lot, Paolo.
- Mark as New
- Bookmark
- Subscribe
- Mute
- Subscribe to RSS Feed
- Permalink
- Report Inappropriate Content
Have you tried to add one more field like "source" and simply concatenate both tables. Thus you have access to full data, but you can still differentiate for the origin.
HTH
Peter
- Mark as New
- Bookmark
- Subscribe
- Mute
- Subscribe to RSS Feed
- Permalink
- Report Inappropriate Content
Hi Peter, thanks a lot for the answer,
yes, I understand what you meant, but it is not what I wanted to reach.
I don't wanna use 'concatenate' because I don't wanna use the editor.
I'd like to concatenate two result without use the editor:
Q1: select 3 fields in the dashboard and store the result in excel (for example)
Q2: select 3 fields in the dashboard and append the new result in the same excel file.
Paolo.