Unlock a world of possibilities! Login now and discover the exclusive benefits awaiting you.
- Qlik Community
- :
- All Forums
- :
- QlikView App Dev
- :
- waterfall chart with dimension
- Subscribe to RSS Feed
- Mark Topic as New
- Mark Topic as Read
- Float this Topic for Current User
- Bookmark
- Subscribe
- Mute
- Printer Friendly Page
- Mark as New
- Bookmark
- Subscribe
- Mute
- Subscribe to RSS Feed
- Permalink
- Report Inappropriate Content
waterfall chart with dimension
Hi All,
I have a QlikView requirement of waterfall chart.
The chart should display the top 10 contributors of revenue from last year vs current year. how should I build my bar chart to do this ?
As of now, my waterfall is like this:
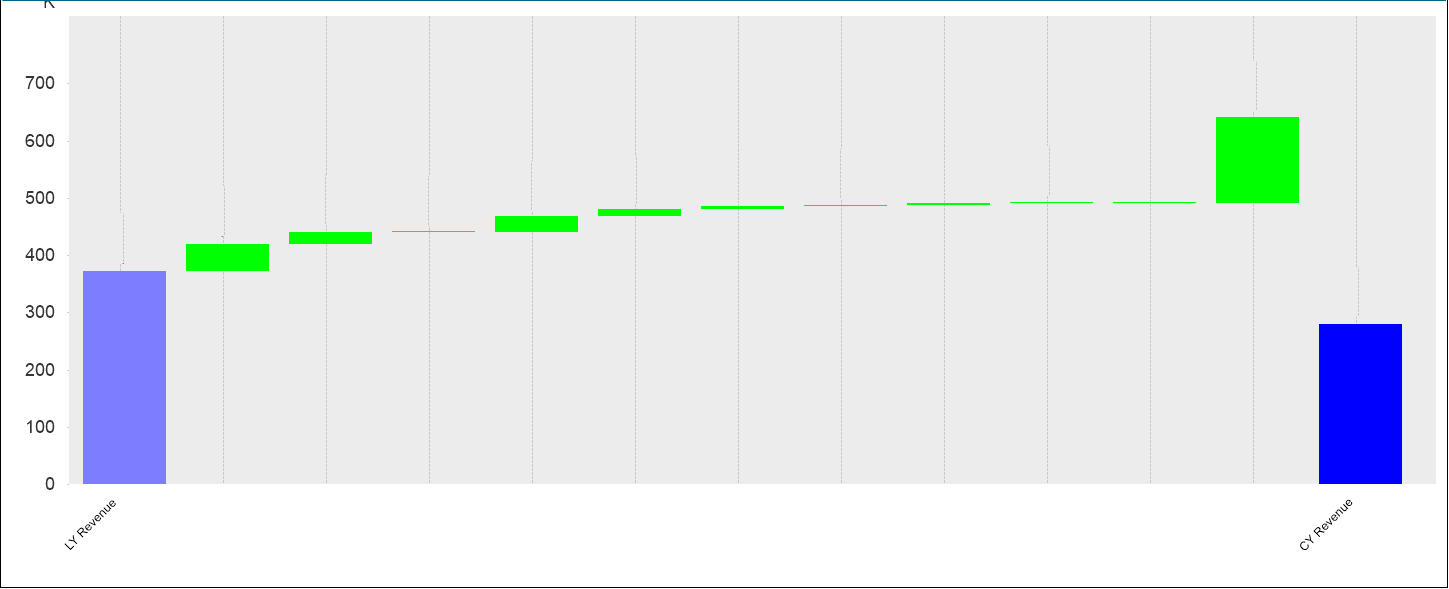
The green bars should display the top 10, let's say, brands. how can i achieve this kind of output ? what should be my expression ? As of now revenue per brands are scripted (no dimension). how can i identify the top 10 brands ?
Thanks !
- Tags:
- waterfall chart
- Mark as New
- Bookmark
- Subscribe
- Mute
- Subscribe to RSS Feed
- Permalink
- Report Inappropriate Content
Please upload qvw file
- Mark as New
- Bookmark
- Subscribe
- Mute
- Subscribe to RSS Feed
- Permalink
- Report Inappropriate Content
Hi MarkTicoy
Please upload sample file with the data. It will help folks to provide solution quickly.
- Mark as New
- Bookmark
- Subscribe
- Mute
- Subscribe to RSS Feed
- Permalink
- Report Inappropriate Content
The qvw file is too big to upload (185 MB).
- Mark as New
- Bookmark
- Subscribe
- Mute
- Subscribe to RSS Feed
- Permalink
- Report Inappropriate Content
Hi MarkTicoy
Use Debug load and limit the no of records to 1000 or to other value. Then size will be reduced. Thank You.
- Mark as New
- Bookmark
- Subscribe
- Mute
- Subscribe to RSS Feed
- Permalink
- Report Inappropriate Content
This does not look like a waterfall chart as I know them. Normally the waterfall elements are the broken-down components of the movement between the starting value (LY in your case) and the ending value (CY), so the first component starts at the LY value, and last movement component ends at the CY value.
Are you sure that this is the best way to display your data?