Unlock a world of possibilities! Login now and discover the exclusive benefits awaiting you.
- Qlik Community
- :
- All Forums
- :
- QlikView App Dev
- :
- Re: x axis on bar chart
- Subscribe to RSS Feed
- Mark Topic as New
- Mark Topic as Read
- Float this Topic for Current User
- Bookmark
- Subscribe
- Mute
- Printer Friendly Page
- Mark as New
- Bookmark
- Subscribe
- Mute
- Subscribe to RSS Feed
- Permalink
- Report Inappropriate Content
x axis on bar chart
Hi,
I m using dollar list box of billions,million, thousand
where the value is
=If(amt='Millions', 1000000,
If(amt='Thousands', 1000,
If(amt='Billion', 100000000,1)))
its assigned to the vAmt variable
now i m using the bar chart
dimension as
MSG field is used
expression as
=sum(spnd )/vAmt
now my issue is when ever i select the thousand or billions or millions in list box, my bar chart x axes should always show the gap interval of 5 10 15 in the x axis to all the list box which select in dollar list box,
when ever i select the millions or billions or thousnand the gap interval in the x axis is getting differ
for example for billions 0.0000 0.0005 0.0010 0.0015
for millions 0.00 0.05 0.10 0.15
for thousand 0 50 100 150
so need this gap interval always to be same as 5 10 100 for any selection in dollar list box
- Mark as New
- Bookmark
- Subscribe
- Mute
- Subscribe to RSS Feed
- Permalink
- Report Inappropriate Content
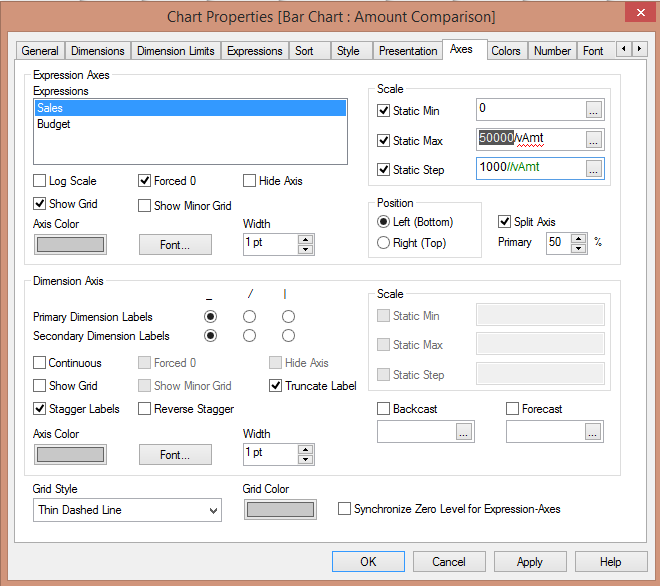
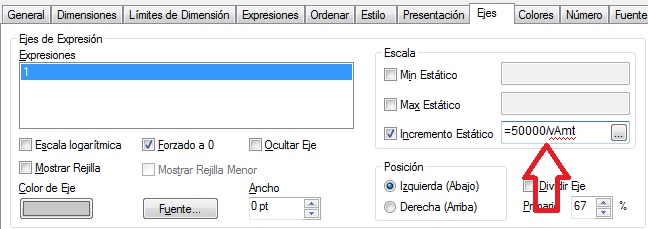
Hi, If your example for billions has left a '0' (0.00005 instead of 0.0005) you can use the 'static increment' in the axis tab, the increment can be:
=50000/vAmt
- Mark as New
- Bookmark
- Subscribe
- Mute
- Subscribe to RSS Feed
- Permalink
- Report Inappropriate Content
can u put me screen shot for this
- Mark as New
- Bookmark
- Subscribe
- Mute
- Subscribe to RSS Feed
- Permalink
- Report Inappropriate Content
statuc i have staic min and static max
- Mark as New
- Bookmark
- Subscribe
- Mute
- Subscribe to RSS Feed
- Permalink
- Report Inappropriate Content
I don't have data but I'm tlaking of this:
- Mark as New
- Bookmark
- Subscribe
- Mute
- Subscribe to RSS Feed
- Permalink
- Report Inappropriate Content
Hi
Here is the image.
Regards,
Kaushik Solanki