Unlock a world of possibilities! Login now and discover the exclusive benefits awaiting you.
- Qlik Community
- :
- All Forums
- :
- QlikView App Dev
- :
- Accumulative sum for two dimensions
- Subscribe to RSS Feed
- Mark Topic as New
- Mark Topic as Read
- Float this Topic for Current User
- Bookmark
- Subscribe
- Mute
- Printer Friendly Page
- Mark as New
- Bookmark
- Subscribe
- Mute
- Subscribe to RSS Feed
- Permalink
- Report Inappropriate Content
Accumulative sum for two dimensions
Greetings!
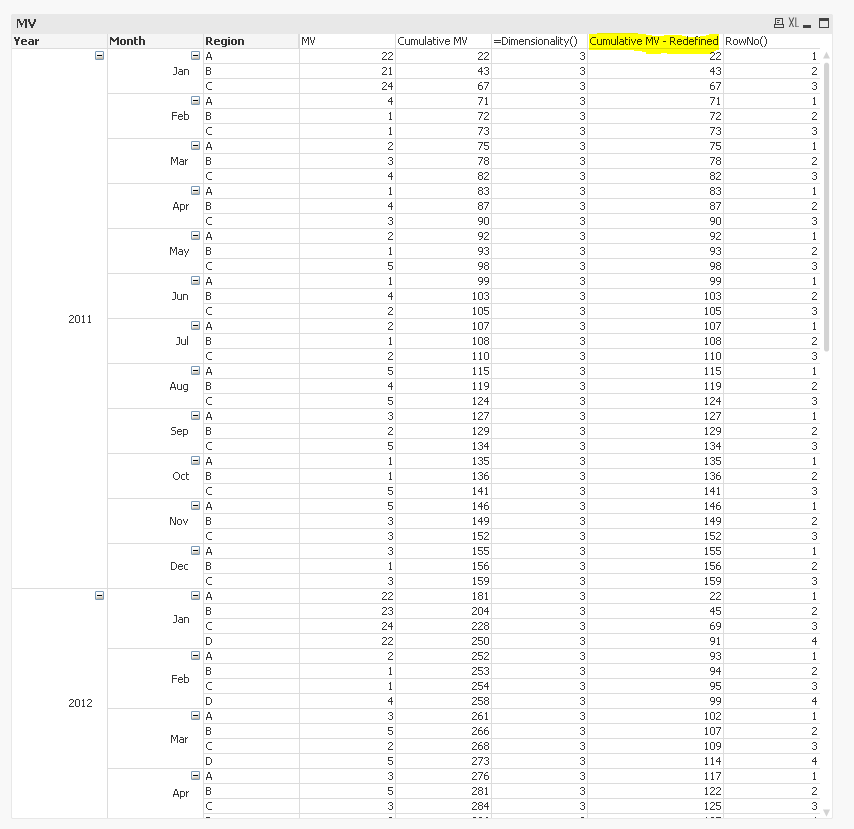
In this example we're trying to accumulate market values, 'MV', by 'Period' (January to December, or last month of the year) and 'Region', (A, B, C, or D), and then graph the results in a line chart.
Using RangeSum(Above(Sum(MV),0,Month)) produces the correct results when the pivot table is collapsed to the 'Period' dimension, but once you expand the pivot table to 'Region' the formula breaks.
We can mimic the correct results by dragging the 'Region' dimension across the top and using the previousRangeSum() formula. But once you convert this pivot table to a line chart the accumulation is lost.
tl;dr
Accumulate market values from January to December (or last month of the year), and break it up by region.
Thanks!
JDM
Accepted Solutions
- Mark as New
- Bookmark
- Subscribe
- Mute
- Subscribe to RSS Feed
- Permalink
- Report Inappropriate Content
Unfortunately, you won't change LOAD order of a field if you do something like
T1:
LOAD Field
FROM Source;
NOCONCATENATE
LOAD Field
RESIDENT T1
ORDER BY Field;
DROP TABLE T1;
When you LOAD Field the second time, the load order of the field will still be determined by the first load (It's not about the order of values in the table, but in the field).
You need to do something like this:
Create a temporary table with Period values ordered chronological first in your script, something like
Tmp:
LOAD
MonthName(AddMonths(Makedate(2011), recno()-1) ) as Period
Autogenerate 36;
Then LOAD your data:
LOAD Period,
Month(Period) as Month,
Year(Period) as Year,
Region,
MV
FROM
(biff, embedded labels, table is Sheet1$);
Then drop the temp table:
DROP TABLE Tmp;
- Mark as New
- Bookmark
- Subscribe
- Mute
- Subscribe to RSS Feed
- Permalink
- Report Inappropriate Content
Like this?
You need to take care that Period is sorted chronological in load order (like in your sample data) to make this solution using advanced aggregation work with your real data.
- Mark as New
- Bookmark
- Subscribe
- Mute
- Subscribe to RSS Feed
- Permalink
- Report Inappropriate Content
Hope you are looking for something like this..
- Mark as New
- Bookmark
- Subscribe
- Mute
- Subscribe to RSS Feed
- Permalink
- Report Inappropriate Content
Hi swuehl!
Thanks for your response. It works in the sample data, but not in my real data.
I've sorted Period and Region in the load script:
Activity_2:
NoConcatenate LOAD
PERIOD,
MONTH,
YEAR,
ACTIVITY,
PERCENTAGE,
COUNTRY,
NAME,
DIVISION,
REGION
Resident Activity_1 Order by PERIOD, REGION;
DROP Table Activity_1;
But when I apply the aggr formula the data breaks again:
Aggr(RangeSum(Above(Sum(ACTIVITY * PERCENTAGE/100),0,MONTH)),REGION,PERIOD)
- Mark as New
- Bookmark
- Subscribe
- Mute
- Subscribe to RSS Feed
- Permalink
- Report Inappropriate Content
Thanks for your reply! The sum should cumulate by region and year. So for example in March 2011: Region A should have a value of 28 (22+4+2) , Region B should have 25, and so on
- Mark as New
- Bookmark
- Subscribe
- Mute
- Subscribe to RSS Feed
- Permalink
- Report Inappropriate Content
Unfortunately, you won't change LOAD order of a field if you do something like
T1:
LOAD Field
FROM Source;
NOCONCATENATE
LOAD Field
RESIDENT T1
ORDER BY Field;
DROP TABLE T1;
When you LOAD Field the second time, the load order of the field will still be determined by the first load (It's not about the order of values in the table, but in the field).
You need to do something like this:
Create a temporary table with Period values ordered chronological first in your script, something like
Tmp:
LOAD
MonthName(AddMonths(Makedate(2011), recno()-1) ) as Period
Autogenerate 36;
Then LOAD your data:
LOAD Period,
Month(Period) as Month,
Year(Period) as Year,
Region,
MV
FROM
(biff, embedded labels, table is Sheet1$);
Then drop the temp table:
DROP TABLE Tmp;
- Mark as New
- Bookmark
- Subscribe
- Mute
- Subscribe to RSS Feed
- Permalink
- Report Inappropriate Content
It worked! Thanks so much!