Unlock a world of possibilities! Login now and discover the exclusive benefits awaiting you.
- Qlik Community
- :
- All Forums
- :
- QlikView App Dev
- :
- Re: Aggr Total question
- Subscribe to RSS Feed
- Mark Topic as New
- Mark Topic as Read
- Float this Topic for Current User
- Bookmark
- Subscribe
- Mute
- Printer Friendly Page
- Mark as New
- Bookmark
- Subscribe
- Mute
- Subscribe to RSS Feed
- Permalink
- Report Inappropriate Content
Aggr Total question
Hi
I'm looking for the correct expression in a pivot table to get the following result
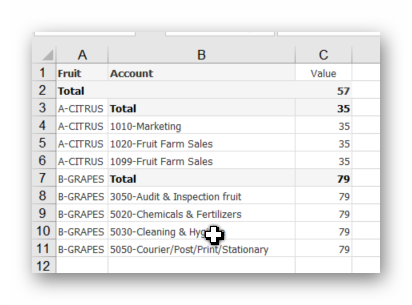
I'm asuming that I have to use the aggr function and that I also have to add total to the expression, but when I try for example the following expression
=aggr(sum(total if(_year=Vyear AND accountGroupCode_mast='A' AND cat_move='MET' AND type_move='Forecast' AND accountDriver_mast='COSTING HA', value)),Fruit,Account)
i get the result
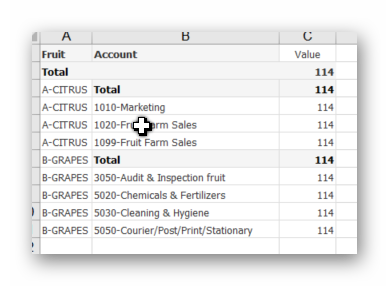
Any ideas of how I should change my expression will be greatly appreciated
Regards,
Jan-Hendrik
- Mark as New
- Bookmark
- Subscribe
- Mute
- Subscribe to RSS Feed
- Permalink
- Report Inappropriate Content
hi, yes thx, I will compile the qvw and post ASAP
- Mark as New
- Bookmark
- Subscribe
- Mute
- Subscribe to RSS Feed
- Permalink
- Report Inappropriate Content
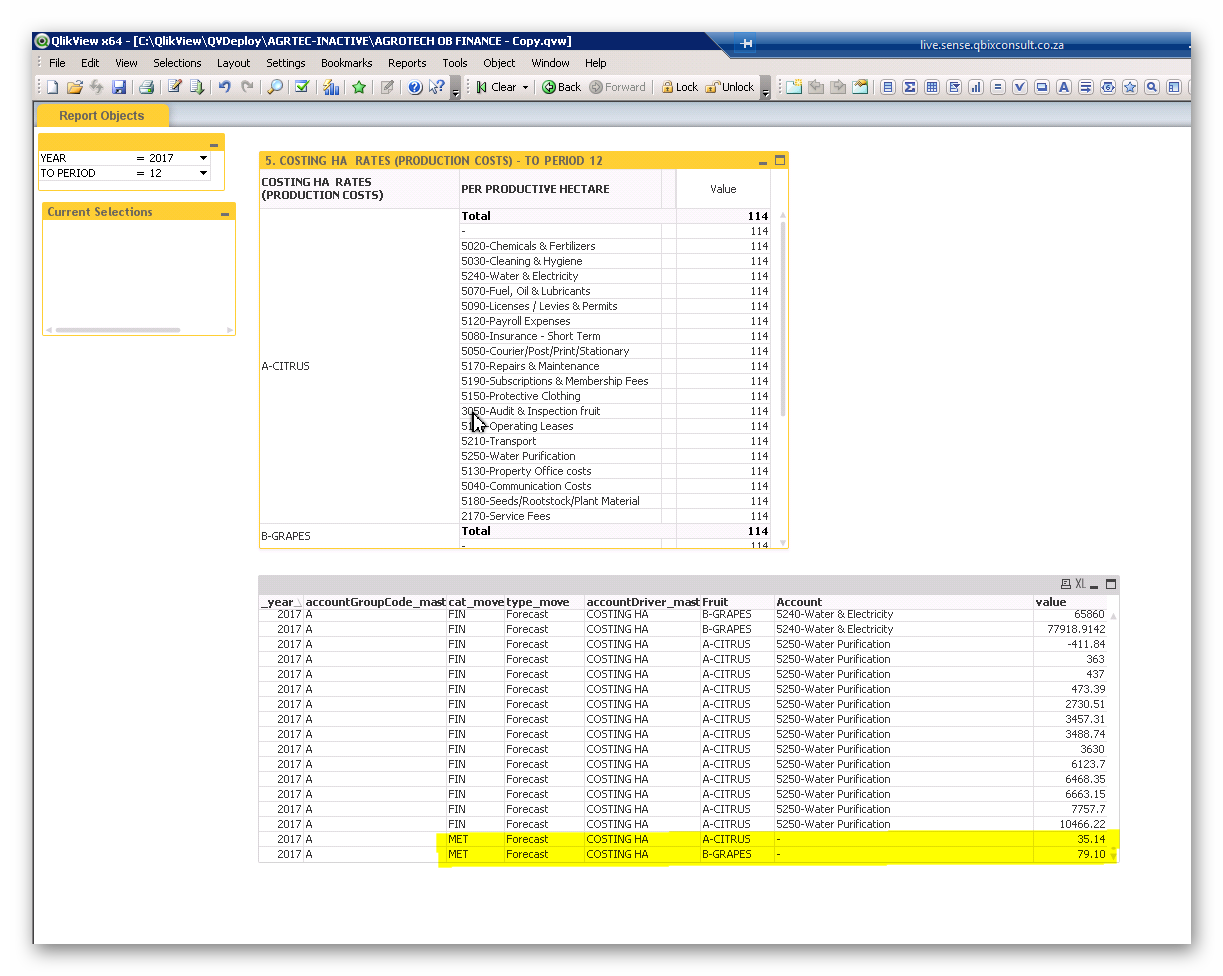
Hi, I have attached the .qvw on my original post,
what makes it a bit complicated is the fact that I'm getting the values by filtering on the field cat_move = 'MET' but I still want to show it aggregated on total by fruit for the different Account lines coming from cat_move = 'FIN'
- Mark as New
- Bookmark
- Subscribe
- Mute
- Subscribe to RSS Feed
- Permalink
- Report Inappropriate Content
But Accounts are Null.
What are Dimensions and Expression formulas in chart ?
- Mark as New
- Bookmark
- Subscribe
- Mute
- Subscribe to RSS Feed
- Permalink
- Report Inappropriate Content
Hi
I have attached my .qvw on the first post (scroll up to beginning)
The reason why the account field is null for cat_move = 'MET' is because it is a metrics value which apply to the whole 2017 year while the records cat_move = 'FIN' are financial values which are posted in different periods (thus not annual)
The reason why they are in the same table is because I also need to calculate financials devided by metrics in other qlikview objects (in this example I only want the metrics, but totaling over the account lines from the financials data set
Do you think it is possible to do?
- Mark as New
- Bookmark
- Subscribe
- Mute
- Subscribe to RSS Feed
- Permalink
- Report Inappropriate Content
Hi,
your second object is table box it will show all data which you are loaded.
In first chart try to use set analysis.
Regards,
Please appreciate our Qlik community members by giving Kudos for sharing their time for your query. If your query is answered, please mark the topic as resolved 🙂
- Mark as New
- Bookmark
- Subscribe
- Mute
- Subscribe to RSS Feed
- Permalink
- Report Inappropriate Content
Please find attached it is working as in sheet1
Following expression can be used
= aggr(NODISTINCT sum({<cat_move={'MET'},Account=,accountGroupCode_mast={'A'},_year={$(Vyear)},type_move={'Forecast'},cat_move={'MET'},accountDriver_mast={'COSTING HA'}>} value),Fruit)
- Mark as New
- Bookmark
- Subscribe
- Mute
- Subscribe to RSS Feed
- Permalink
- Report Inappropriate Content
great, thanks Mangal, that is what I'm looking for
- Mark as New
- Bookmark
- Subscribe
- Mute
- Subscribe to RSS Feed
- Permalink
- Report Inappropriate Content
thanks Antonio, Mangal gave me an expression I could use
- Mark as New
- Bookmark
- Subscribe
- Mute
- Subscribe to RSS Feed
- Permalink
- Report Inappropriate Content
What you want to show in chart???
the value which have cat_mov = 'MET' or cat_mov = 'FIN'
Try below expression
sum({<accountGroupCode_mast={"A"},type_move={"Forecast"},accountDriver_mast={"COSTING HA"},_year={"$(Vyear)"}>}value)
Regards,
Please appreciate our Qlik community members by giving Kudos for sharing their time for your query. If your query is answered, please mark the topic as resolved 🙂
- Mark as New
- Bookmark
- Subscribe
- Mute
- Subscribe to RSS Feed
- Permalink
- Report Inappropriate Content
thanks, Mangal assisted me with correct answer