Unlock a world of possibilities! Login now and discover the exclusive benefits awaiting you.
- Qlik Community
- :
- All Forums
- :
- QlikView App Dev
- :
- Re: Aggregating Purchases by Hour and Day
- Subscribe to RSS Feed
- Mark Topic as New
- Mark Topic as Read
- Float this Topic for Current User
- Bookmark
- Subscribe
- Mute
- Printer Friendly Page
- Mark as New
- Bookmark
- Subscribe
- Mute
- Subscribe to RSS Feed
- Permalink
- Report Inappropriate Content
Aggregating Purchases by Hour and Day
Hello --
I am working through a problem and having some difficulty getting the result I am looking for.
Below is a simple table of what I am trying to achieve.
| Merchandise Division | Hour | Day | Hour (All) | Day (All) |
|---|---|---|---|---|
| Apparel | 10 | Mon | 8 | Tues |
| Accessories | 15 | Tues | 8 | Tues |
| Cosmetics | 17 | Tues | 8 | Tues |
| Electronics | 9 | Sun | 8 | Tues |
What I am looking for here is the top number of sales by hour and day per listed merchandise division. The goal would be to sum the orders by hour and day and output the hour and day which had the highest number of sales per division. I would also like to list the top hour across all division and days within the table as well.
I've tried a few set analyses but I think what I am trying to achieve is a bit more robust then I can handle.
Any thoughts on how one might achieve this?
Best,
Dan
- Mark as New
- Bookmark
- Subscribe
- Mute
- Subscribe to RSS Feed
- Permalink
- Report Inappropriate Content
!Hello -
I am attaching a small data set in Excel which may help with understanding the inputs I am working with.
Thanks,
Dan
- Mark as New
- Bookmark
- Subscribe
- Mute
- Subscribe to RSS Feed
- Permalink
- Report Inappropriate Content
Check the attached
- Mark as New
- Bookmark
- Subscribe
- Mute
- Subscribe to RSS Feed
- Permalink
- Report Inappropriate Content
- Mark as New
- Bookmark
- Subscribe
- Mute
- Subscribe to RSS Feed
- Permalink
- Report Inappropriate Content
Hi,
Thanks for the reply.
Is there a way to just return the highest value per division.
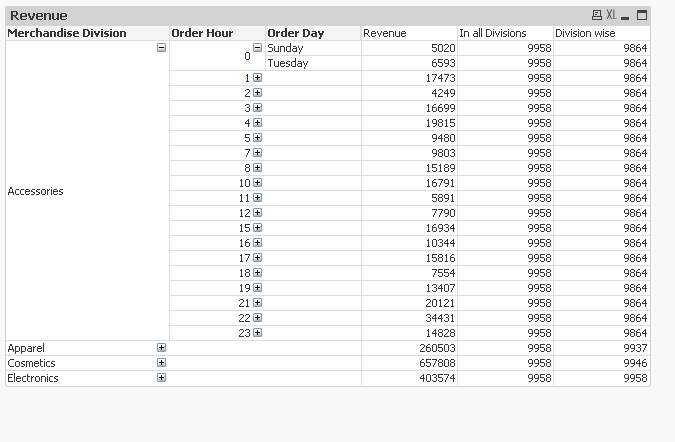
For example, the Accessories category has the most revenue during hour 4... I would then want to see what day has the highest revenue regardless of the hour. So the accessories table may look like this:
| Division | Top Order Hour | Top Order Day | In All Division / Hour | In All Division / Day |
|---|---|---|---|---|
| Accessories | 4 | Tuesday? | 10? | Wednesday? |
I guess this could be achieved by a sort using what you provided.
Thanks for the help!
Dan