Unlock a world of possibilities! Login now and discover the exclusive benefits awaiting you.
- Qlik Community
- :
- All Forums
- :
- QlikView App Dev
- :
- Average by client/year/category and by client/year...
- Subscribe to RSS Feed
- Mark Topic as New
- Mark Topic as Read
- Float this Topic for Current User
- Bookmark
- Subscribe
- Mute
- Printer Friendly Page
- Mark as New
- Bookmark
- Subscribe
- Mute
- Subscribe to RSS Feed
- Permalink
- Report Inappropriate Content
Average by client/year/category and by client/year side-by-side?
Hi, I think I answered my own question by the end of my typing, but welcome peer review and will give helpful/correct answer credits for feedback. Sharing my thought process in case it helps anyone else who might've gotten stuck. (Just seemed a shame to setup something like this only to delete it.)
I have a table with fields like Client, Billing Category (values vary widely by client for reasons), Year, Count provided to me by Team A. Team B has a qlikview that averages the counts over time by client and category.
So I have this at the start
Client Year Category Count
A 2016 Em 10
A 2016 Sp 5
A 2017 Em 9
A 2017 Sp 6
B 2016 US 100
B 2016 CAN 80
B 2016 MEX 70
B 2017 US 90
B 2017 CAN 60
B 2017 MEX 60
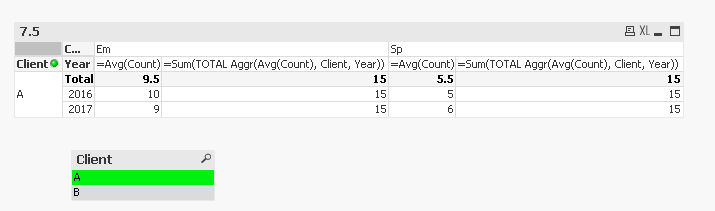
And I used a pivot table object with dimensions client year category and an expression that correctly averaged the counts
We'll assume always only one client selected going forward because they really are apples and oranges on the category front
Client Year Category-> Em Sp
Overall Average by Category: 9.5 5.5 //I used the pivot table subtotals function to make this row
A 2017 9 6
A 2016 10 5
Now Team A is requesting the total average irrespective of category on this table and for use as denominators in other metrics. For the moment, I reloaded the initial table without category and did a sum(count) as CategoryTotal grouped by client and year to quickly get a separate table down like this:
Client Year CategoryTotal
Overall Average: 15
A 2017 15
A 2016 15
I want to make these two tables into a single table in script, but my brain is fatigued now. I think I could do a crosstable load on the first table in script to make (a lot of nonstandard named) fields out of the category values... Then concatenate load the totals table onto that with maybe 'CategoryTotal' as the Category and the CategoryTotal field as the number.... ...and I think I just solved this by talking to myself in here... I will share example of final script that works when done.
I wonder if bloggers do this, then just turn the question at the top into a declaration and call it a blog. 
Accepted Solutions
- Mark as New
- Bookmark
- Subscribe
- Mute
- Subscribe to RSS Feed
- Permalink
- Report Inappropriate Content
That does make sense, but isn't the goal to use them as denominator? Plan to use set analysis with total to get it done?
- Mark as New
- Bookmark
- Subscribe
- Mute
- Subscribe to RSS Feed
- Permalink
- Report Inappropriate Content
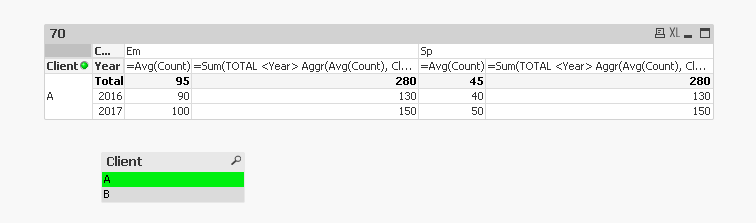
Not sure if the requirement is to get this in the script, but there is a expression you can use to get 15 in the denominator. The expression is:
=Sum(TOTAL Aggr(Avg(Count), Client, Year))
- Mark as New
- Bookmark
- Subscribe
- Mute
- Subscribe to RSS Feed
- Permalink
- Report Inappropriate Content
Thanks Sunny T. The tough part of that one is it ends with multiple totals columns. (one in each category).
Here's a solution I hammered out with some crosstable stuff just now:
CrossTable(Count, Data, 3)
LOAD Client, Year, Category, Count FROM
(ooxml, embedded labels, table is Sheet1);
concatenate LOAD Client,
Year,
'CategoryTotal' as Category,
sum(Count) as Data
FROM
(ooxml, embedded labels, table is Sheet1)
Group by Client, Year;
avg(Data) is the only expression below.

- Mark as New
- Bookmark
- Subscribe
- Mute
- Subscribe to RSS Feed
- Permalink
- Report Inappropriate Content
That does make sense, but isn't the goal to use them as denominator? Plan to use set analysis with total to get it done?
- Mark as New
- Bookmark
- Subscribe
- Mute
- Subscribe to RSS Feed
- Permalink
- Report Inappropriate Content
Yep, that was the next step and the expression you gave does the trick for that.
So like
=count(Distinct TotalPeopleWhoDidStuff) //or whatever the numerator expression is
/
Sum(TOTAL Aggr(Avg(Count), Client, Year)) //divided by your expression to make the avg population count over time as the denominator
Answers the question of 'what percentage of the average population did stuff?' (avg population is used for fuzzy logic reasons of helping stuff be reasonably comparable over time)
- Mark as New
- Bookmark
- Subscribe
- Mute
- Subscribe to RSS Feed
- Permalink
- Report Inappropriate Content
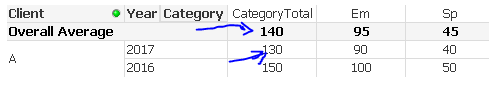
Although now I am curious to know if you are dividing 90/130 and 40/130 (individual averages) or 90/140 and 40/140 (total average)
- Mark as New
- Bookmark
- Subscribe
- Mute
- Subscribe to RSS Feed
- Permalink
- Report Inappropriate Content
In case you want to divide each by their Category Total. You can try this expression:
=Sum(TOTAL <Year> Aggr(Avg(Count), Client, Year, Category))
- Mark as New
- Bookmark
- Subscribe
- Mute
- Subscribe to RSS Feed
- Permalink
- Report Inappropriate Content
The categories are actually groups of people that randomly change in size over time, and Team B wants the average over that time to help smooth out the impact of any dramatic change between one month and the next. (I used years in my example to keep it simple.)
So the bold number at the top of my table is averaging the numbers below it. Since pivot tables don't let you select a totals type, I had to use an avg() expression which just shows the individual data points on the client/year rows, and lets the average of those rows come through to the 'subtotals' row at the top. (I could name it better, maybe average over time, to indicate it is averaging the numbers below it in that category.)
In the actual analysis, there is the big caveat to using an average in that it can rise or fall (however smoothly) while the overall activity completion only goes up (if we count all who did it and not just who's still there). This means toward the end of a year, some activities with alot of traffic might run over the 100% mark. But if we switch to counting only who's currently present, we lose sight of the traffic that's happened in the numerator, and the denominator can get knocked around by big layoffs or acquisitions, either of which make numbers hard to compare over time.
So we use the avg population counts in the denominator since people have a comfortable understanding of that, and we use all current and former people who completed a current activity in the counts of the numerator. (I think the activities persisting through population fluctuations is what makes things a bit fuzzy.)
Edit: It will be set analysis in that one set of selections listboxes will operate the numerator and another set will operate the denominator. (It may not need alternate states since the denominator only needs a few fields and is only connected on client name which does need to be the same.)
- Mark as New
- Bookmark
- Subscribe
- Mute
- Subscribe to RSS Feed
- Permalink
- Report Inappropriate Content
Quick note that the approach to use sum(TOTAL ) and the other approach to build totals into the table in script would be mutually exclusive. If using SUM(TOTAL ) on a field that has a total built into it, one should do something like SUM(TOTAL if(FieldName<>'Totals',... )) I think. Alternatively use if(fieldname='Totals',....) if the end user doesn't need to filter to specific subtotals in that field.
So, probably best to just pick one or the other approach depending on need/requirements.
PS> It is noteworthy that putting totals in script where possible allows for use of table boxes and maybe simpler expressions on the front end which would greatly reduce page load times and be less demanding on server resources. You'd just have to be careful to remember totals are in that field and adjust accordingly when writing expressions in charts.